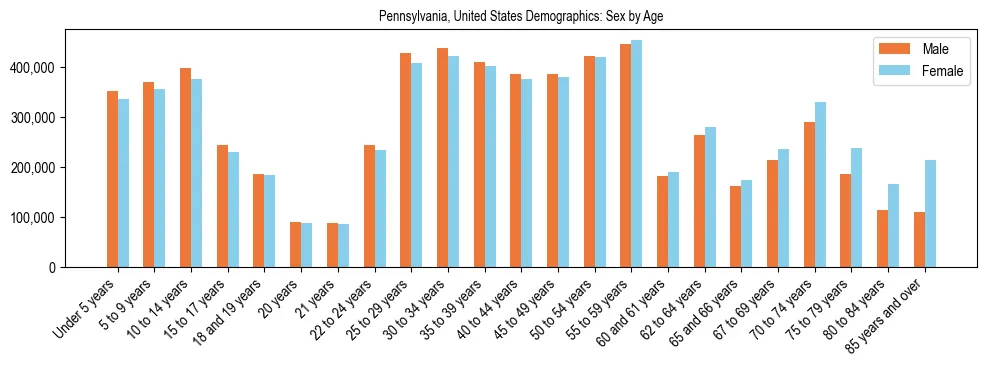
The total population of Pennsylvania, United States is 12,989,208. The median age of the population of Pennsylvania, United States is 40.8 years. The median age for males is 39.5 years. The median age for females is 42.2 years. The chart shows the distribution of the population of Pennsylvania, United States by sex & age (gender & age demographics). New York is next with a population of 19,994,379, followed by Florida, which has a population of 21,634,529.
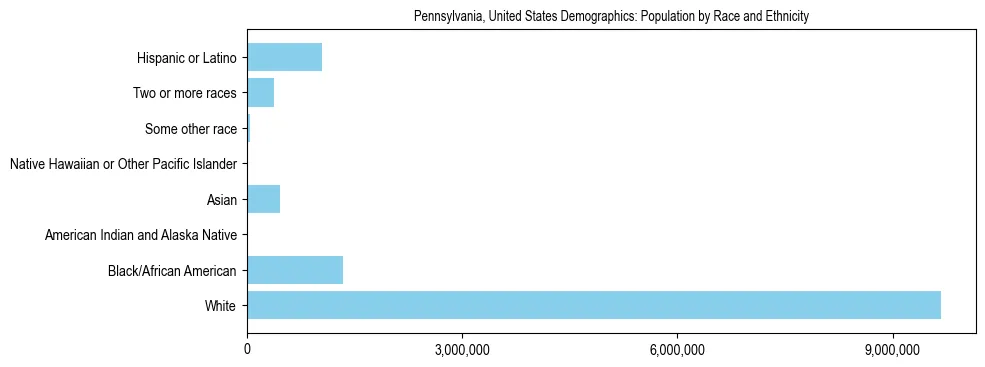
The chart shows the breakdown of the total population of Pennsylvania, United States by race and ethnicity (racial demographics), which is as follows: White: 74.46%; Black/African American: 10.38%; American Indian and Alaska Native: 0.06%; Asian: 3.61%; Native Hawaiian or Other Pacific Islander: 0.02%; Some other race: 0.37%; Two or more races: 2.98%; Hispanic or Latino: 8.12%.
Pennsylvania, United States has a diversity score of 0.5739, which suggests a somewhat moderate level of diversity. There is diversity, but a few groups have significantly larger proportions compared to others.
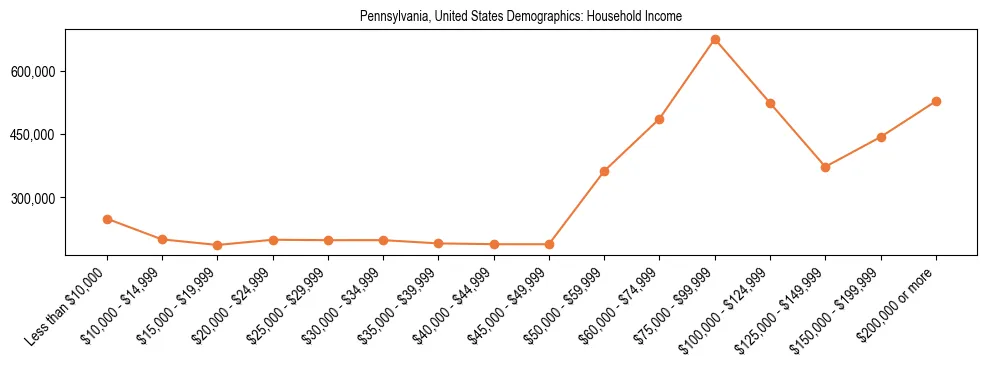
The median household income in Pennsylvania, United States in the past 12 months, in 2022 inflation-adjusted dollars, was $73,170. The chart shows the distribution of household income by income level for the population of Pennsylvania, United States.
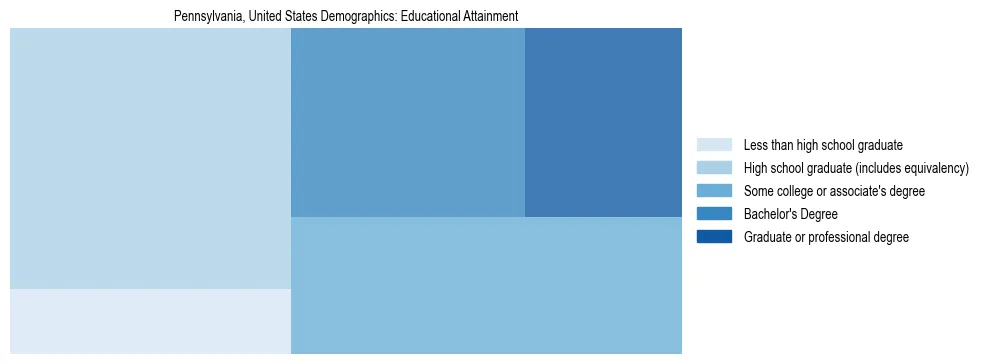
The chart shows the breakdown of the total population, 25 and older, of Pennsylvania, United States by educational attainment, which is as follows: Less than high school graduate: 8.34%; High school graduate (includes equivalency): 33.51%; Some college or associate's degree: 24.40%; Bachelor's Degree: 20.21%; Graduate or professional degree: 13.55%. 33.76% of the population, 25 and older, of Pennsylvania, United States has a Bachelor's degree or higher.
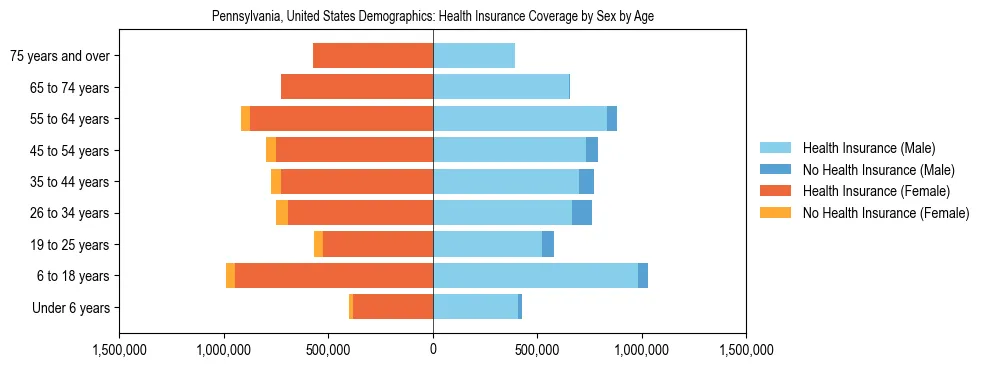
The chart shows the distribution of health insurance coverage status by sex by age for the population of Pennsylvania, United States. 6.12% of the population of Pennsylvania, United States has no health insurance coverage.
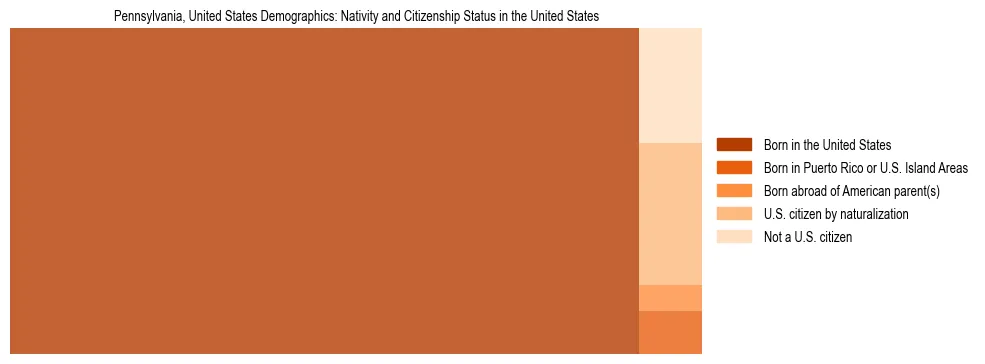
The chart shows the breakdown of the population of Pennsylvania by nativity and citizenship status in the United States. 96.77% of the population of Pennsylvania are United States citizens, including residents born in the United States, born in Puerto Rico or United States Island Areas, born abroad of American parent(s), or by naturalization. 4.02% of the population of Pennsylvania, United States are citizens by naturalization.
Note on the available American Community Survey (ACS) data sources:
The data and analysis of these topics is based on the
United States Census Bureau's
American Community Survey (ACS)
5-Year Estimates (current 2022 Edition). These estimates are also available for select geographies, depending on the size of the population, based on
ACS 1-Year Estimates or
ACS 1-Year Supplemental Estimates. The margin of error data is available for all reports.