US ZIP Code 40065 Nativity & Citizenship Status (2024)
Place of birth and citizenship status analysis for US ZIP Code 40065
US ZIP Code 40065 Nativity & Citizenship Indicators (2024)
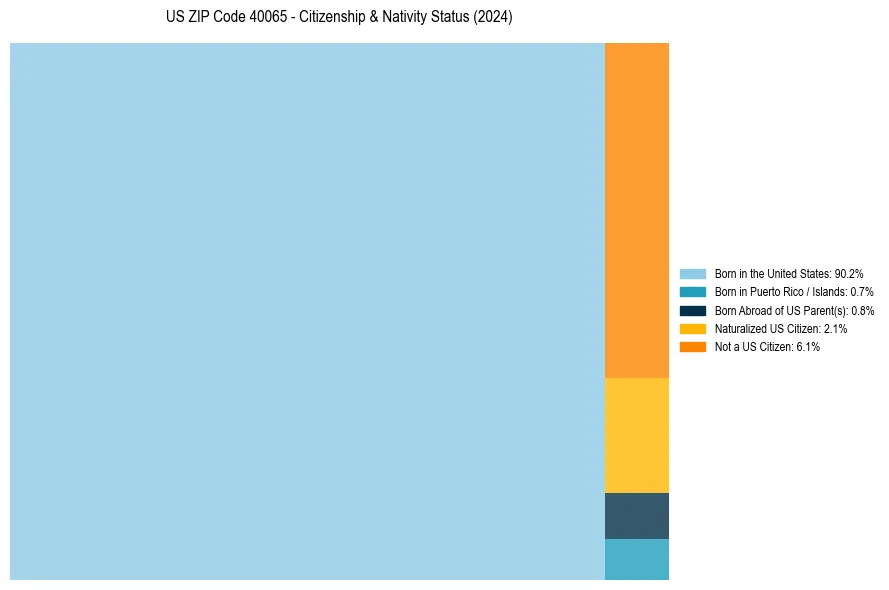
Native Born
91.8%
Foreign Born
8.2%
Naturalized
2.1%
US Citizens
93.9%
US ZIP Code 40065 Nativity & Citizenship Distribution
US ZIP Code 40065 Historical Nativity Trends (2021–2024)
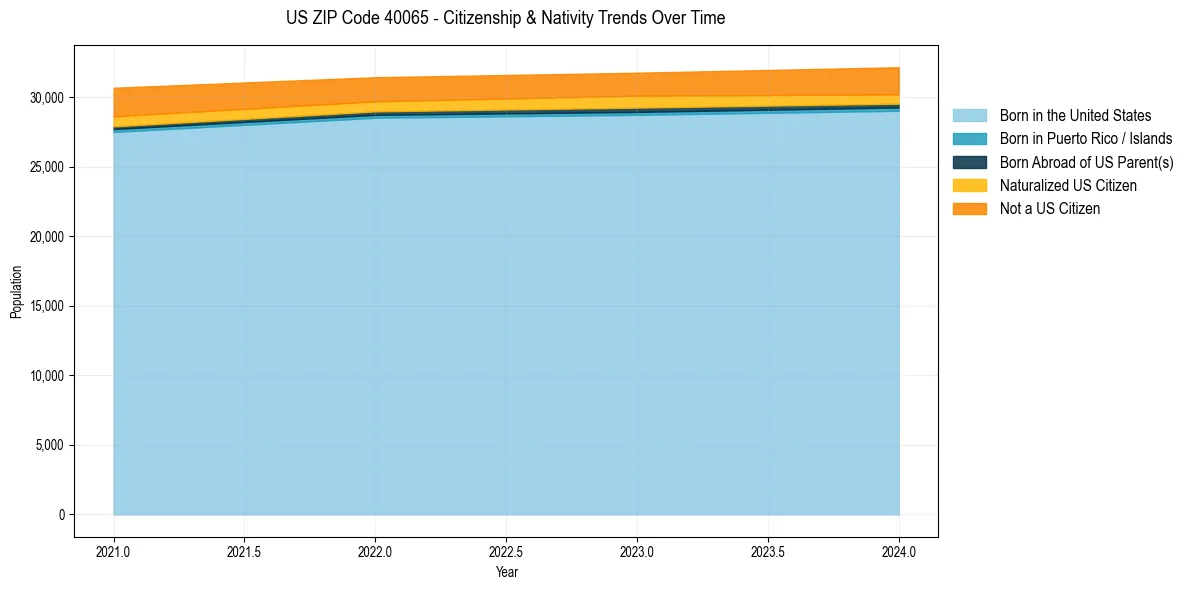
US ZIP Code 40065 Population & Nativity History
| Year | Total Pop | Foreign Born | Native Born |
|---|---|---|---|
| 2024 | 32,160 | 8.2% | 91.8% |
| 2023 | 31,763 | 7.9% | 92.1% |
| 2022 | 31,439 | 7.8% | 92.2% |
| 2021 | 30,682 | 9.1% | 90.9% |
Nativity & Citizenship FAQs for US ZIP Code 40065
Approximately 8.2% of residents in US ZIP Code 40065 were born outside the United States.
The vast majority of residents, roughly 93.9%, are U.S. citizens (including both native-born and naturalized citizens).