US ZIP Code 37916 Race & Ethnicity Demographics (2024)
Racial distribution and diversity statistics for US ZIP Code 37916
US ZIP Code 37916 Diversity Indicators (2024)
Total Population
15,583
Diversity Score
34.0
Diversity Tier
Moderate-Low
Largest Group
White (Non-Hispanic)
80.6%%
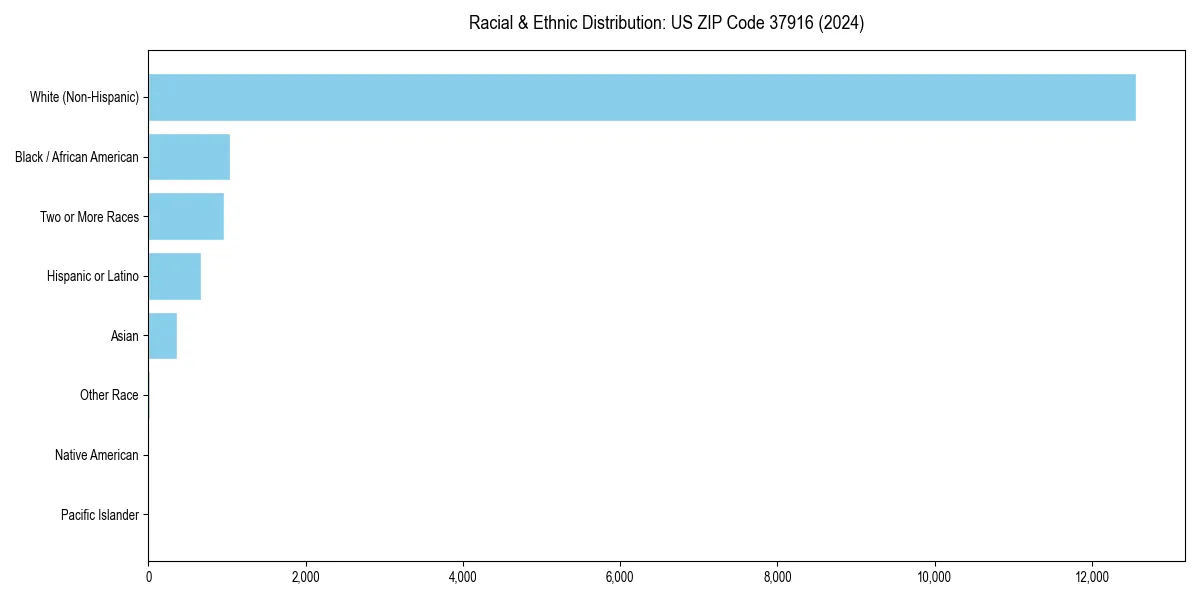
US ZIP Code 37916 Racial & Ethnic Breakdown
US ZIP Code 37916 Historical Diversity Trend (2021–2024)
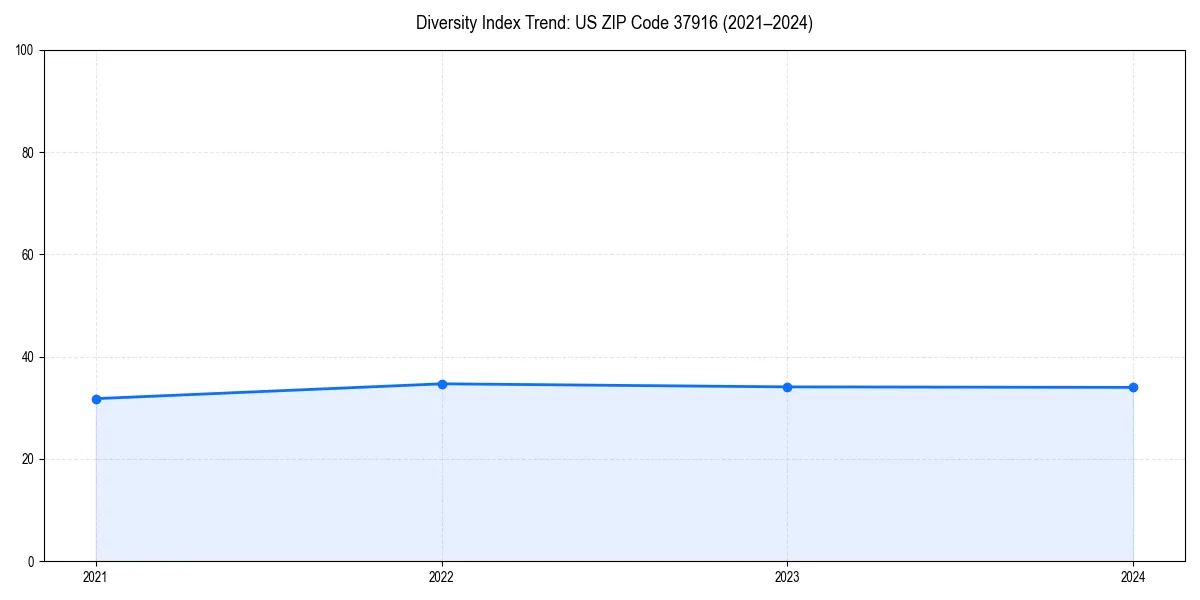
Since 2021, the diversity index of US ZIP Code 37916 has increased slightly.
US ZIP Code 37916 Population by Race & Ethnicity
| Race / Ethnicity | Population | Percentage |
|---|---|---|
| White (Non-Hispanic) | 12,555 | 80.6% |
| Black / African American | 1,031 | 6.6% |
| Two or More Races | 955 | 6.1% |
| Hispanic or Latino | 662 | 4.2% |
| Asian | 362 | 2.3% |
| Other Race | 16 | 0.1% |
| Native American | 2 | 0.0% |
| Pacific Islander | 0 | 0.0% |
Diversity & Demographics FAQs for US ZIP Code 37916
The largest racial or ethnic group in US ZIP Code 37916 is White (Non-Hispanic), which makes up 80.6% of the total population.
Since 2021, the diversity index for US ZIP Code 37916 has increased slightly. The area currently has a diversity score of 34.0/100, which is considered a Moderate-Low level of diversity.