US ZIP Code 10543 Nativity & Citizenship Status (2024)
Place of birth and citizenship status analysis for US ZIP Code 10543
US ZIP Code 10543 Nativity & Citizenship Indicators (2024)
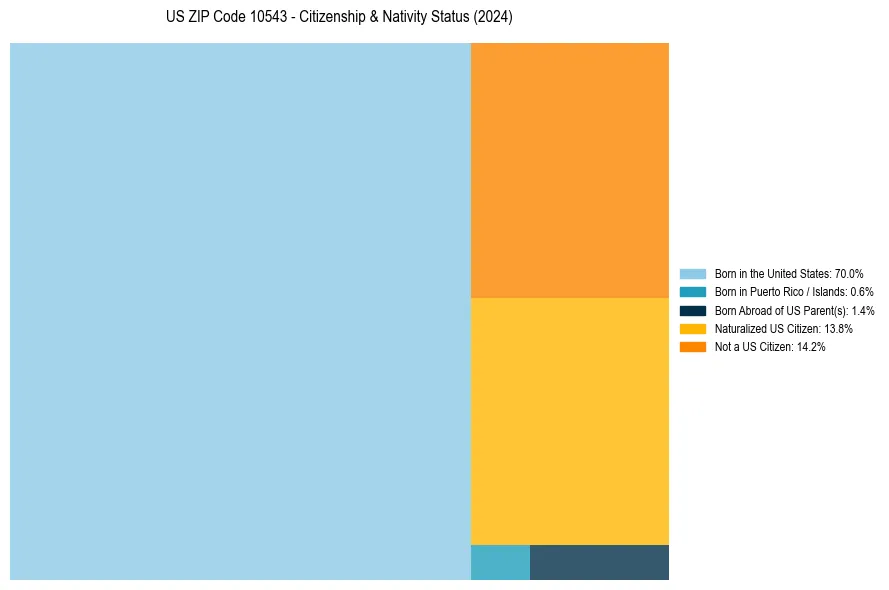
Native Born
72.0%
Foreign Born
28.0%
Naturalized
13.8%
US Citizens
85.8%
US ZIP Code 10543 Nativity & Citizenship Distribution
US ZIP Code 10543 Historical Nativity Trends (2021–2024)
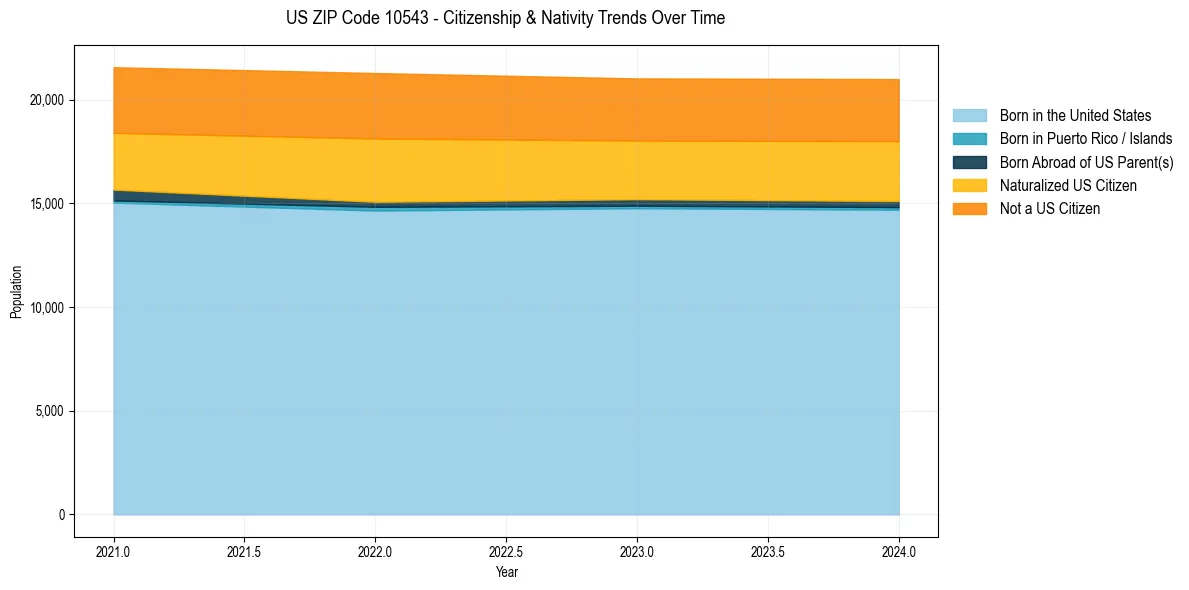
US ZIP Code 10543 Population & Nativity History
| Year | Total Pop | Foreign Born | Native Born |
|---|---|---|---|
| 2024 | 20,989 | 28.0% | 72.0% |
| 2023 | 21,022 | 27.7% | 72.3% |
| 2022 | 21,281 | 29.2% | 70.8% |
| 2021 | 21,563 | 27.4% | 72.6% |
Nativity & Citizenship FAQs for US ZIP Code 10543
Approximately 28.0% of residents in US ZIP Code 10543 were born outside the United States.
The vast majority of residents, roughly 85.8%, are U.S. citizens (including both native-born and naturalized citizens).