US ZIP Code 10453 Nativity & Citizenship Status (2024)
Place of birth and citizenship status analysis for US ZIP Code 10453
US ZIP Code 10453 Nativity & Citizenship Indicators (2024)
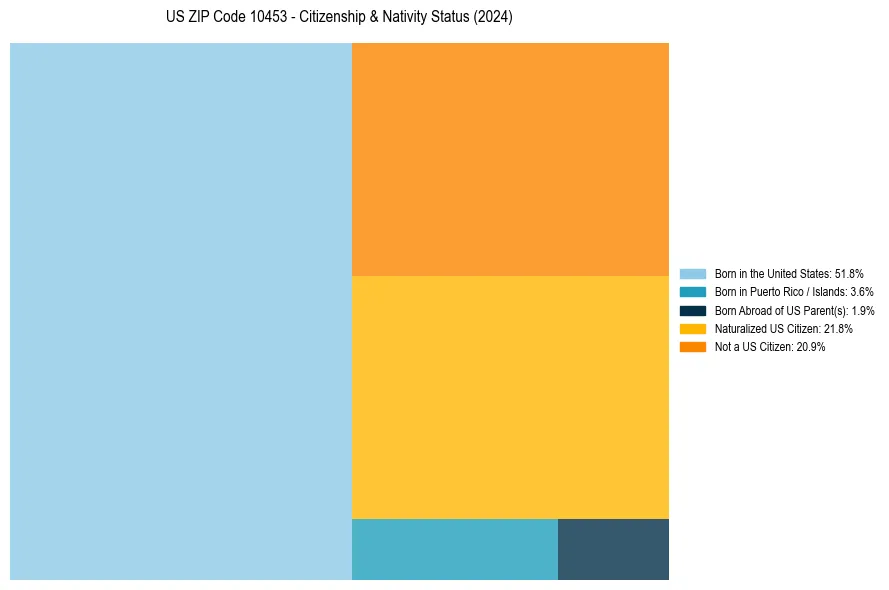
Native Born
57.4%
Foreign Born
42.6%
Naturalized
21.8%
US Citizens
79.1%
US ZIP Code 10453 Nativity & Citizenship Distribution
US ZIP Code 10453 Historical Nativity Trends (2021–2024)
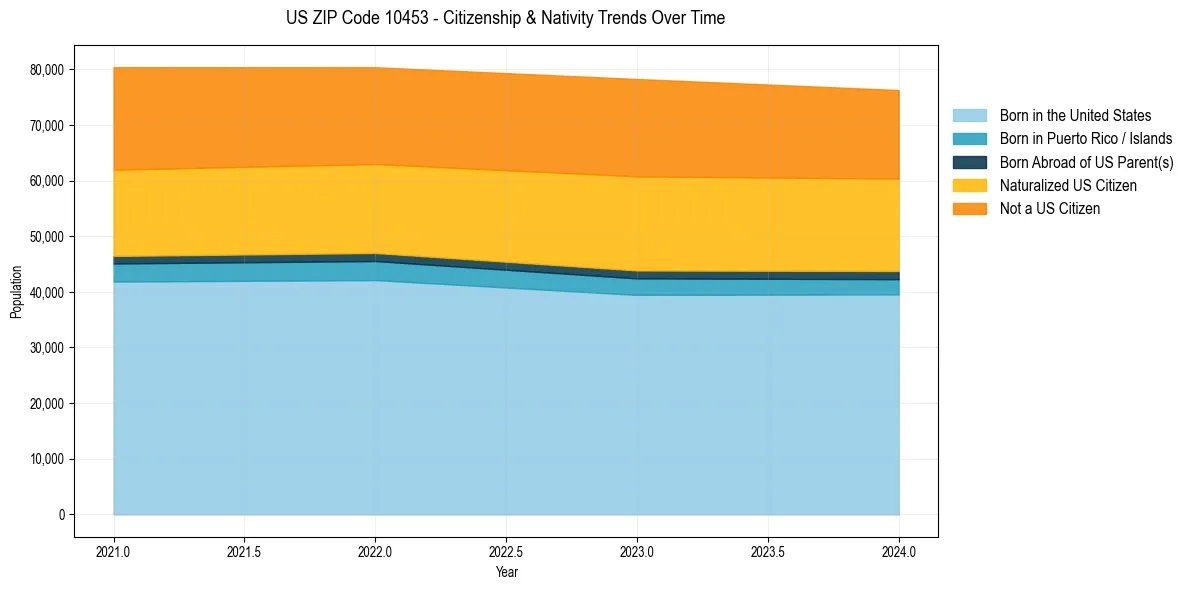
US ZIP Code 10453 Population & Nativity History
| Year | Total Pop | Foreign Born | Native Born |
|---|---|---|---|
| 2024 | 76,282 | 42.6% | 57.4% |
| 2023 | 78,270 | 44.0% | 56.0% |
| 2022 | 80,385 | 41.5% | 58.5% |
| 2021 | 80,393 | 42.2% | 57.8% |
Nativity & Citizenship FAQs for US ZIP Code 10453
Approximately 42.6% of residents in US ZIP Code 10453 were born outside the United States.
The vast majority of residents, roughly 79.1%, are U.S. citizens (including both native-born and naturalized citizens).