Teton County, Wyoming Nativity & Citizenship Status (2024)
Place of birth and citizenship status analysis for Teton County, Wyoming
Teton County, Wyoming Nativity & Citizenship Indicators (2024)
Native Born
86.3%
Foreign Born
13.7%
Naturalized
4.8%
US Citizens
91.1%
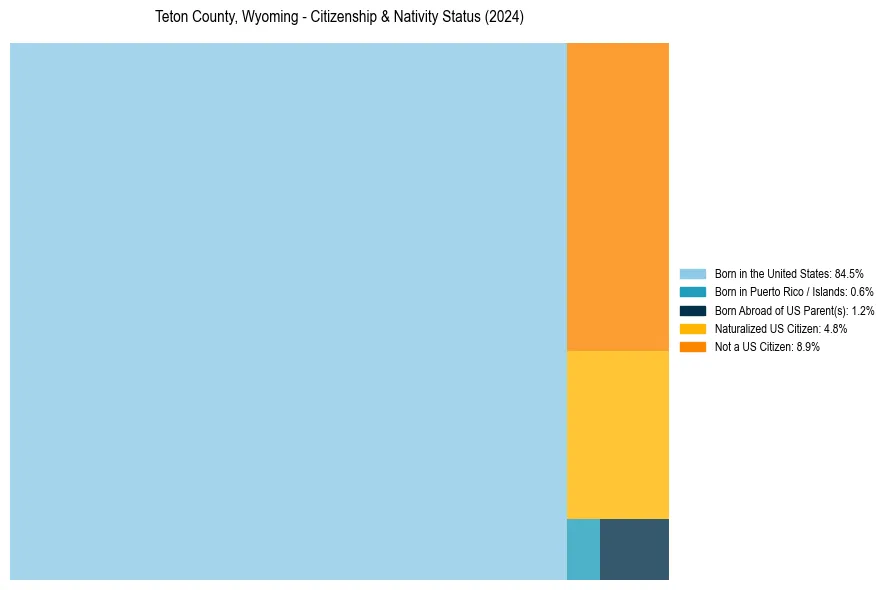
Teton County, Wyoming Nativity & Citizenship Distribution
Teton County, Wyoming Historical Nativity Trends (2010–2024)
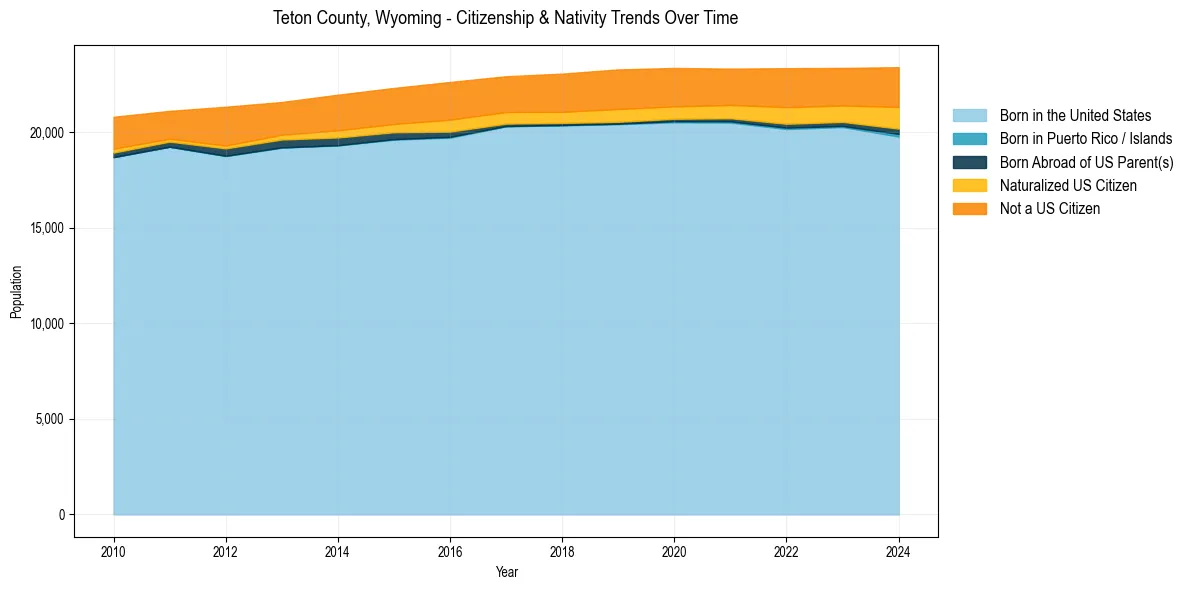
Teton County, Wyoming Population & Nativity History
| Year | Total Pop | Foreign Born | Native Born |
|---|---|---|---|
| 2024 | 23,396 | 13.7% | 86.3% |
| 2023 | 23,358 | 12.1% | 87.9% |
| 2022 | 23,346 | 12.5% | 87.5% |
| 2021 | 23,319 | 11.1% | 88.9% |
| 2020 | 23,356 | 11.4% | 88.6% |
| 2019 | 23,280 | 11.8% | 88.2% |
| 2018 | 23,059 | 11.2% | 88.8% |
| 2017 | 22,923 | 10.8% | 89.2% |
| 2016 | 22,623 | 11.5% | 88.5% |
| 2015 | 22,311 | 10.4% | 89.6% |
| 2014 | 21,956 | 10.2% | 89.8% |
| 2013 | 21,575 | 9.1% | 90.9% |
| 2012 | 21,326 | 10.2% | 89.8% |
| 2011 | 21,111 | 7.6% | 92.4% |
| 2010 | 20,802 | 9.0% | 91.0% |
Nativity & Citizenship FAQs for Teton County, Wyoming
Approximately 13.7% of residents in Teton County, Wyoming were born outside the United States.
The vast majority of residents, roughly 91.1%, are U.S. citizens (including both native-born and naturalized citizens).