Wyoming Nativity & Citizenship Status (2024)
Place of birth and citizenship status analysis for Wyoming
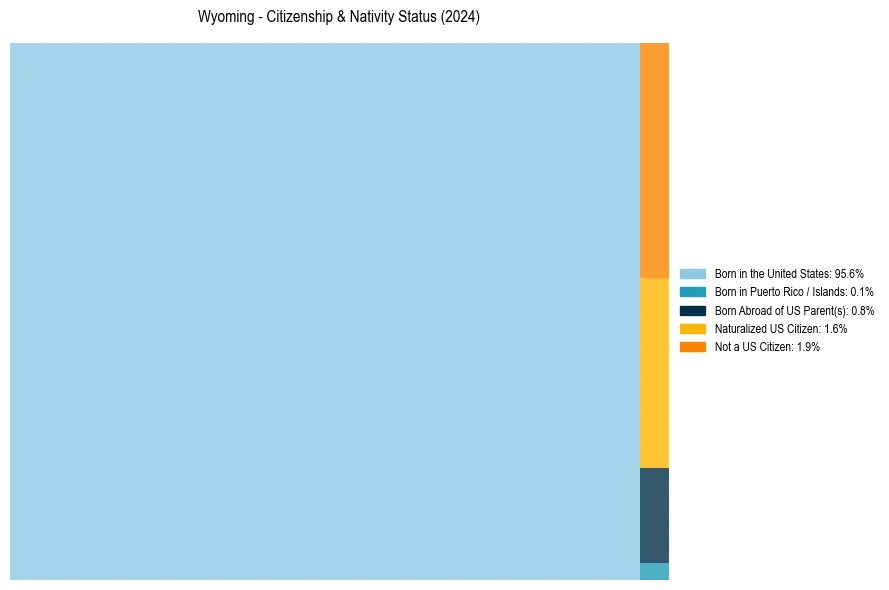
Wyoming Nativity & Citizenship Indicators (2024)
Native Born
96.5%
Foreign Born
3.5%
Naturalized
1.6%
US Citizens
98.1%
Wyoming Nativity & Citizenship Distribution
Wyoming Historical Nativity Trends (2010–2024)
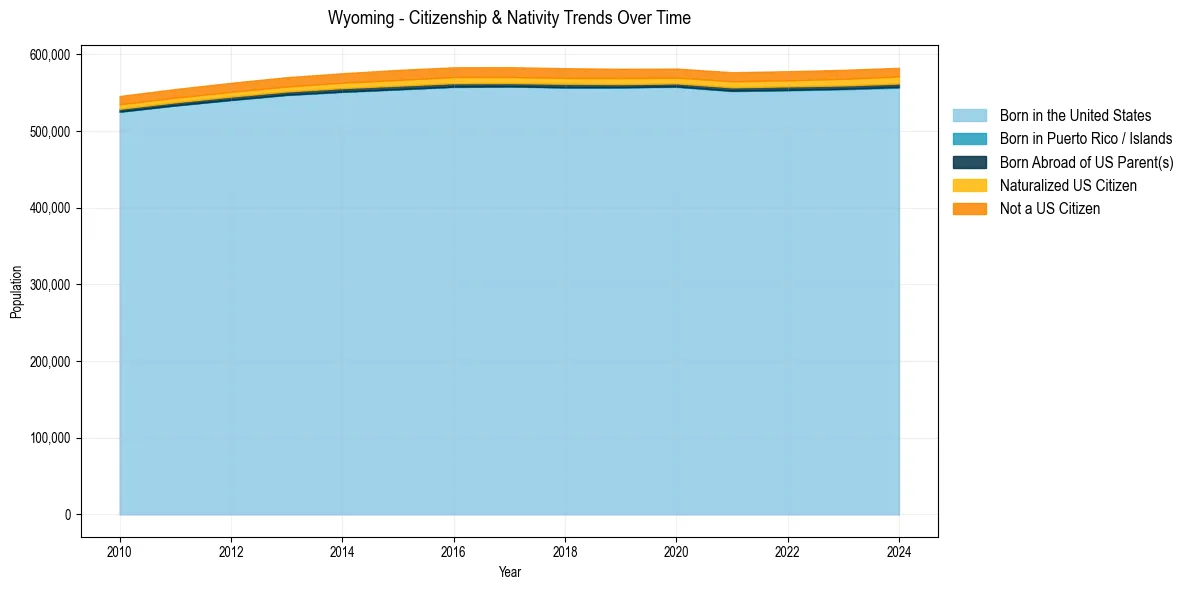
Wyoming Population & Nativity History
| Year | Total Pop | Foreign Born | Native Born |
|---|---|---|---|
| 2024 | 582,397 | 3.5% | 96.5% |
| 2023 | 579,761 | 3.5% | 96.5% |
| 2022 | 577,929 | 3.4% | 96.6% |
| 2021 | 576,641 | 3.4% | 96.6% |
| 2020 | 581,348 | 3.3% | 96.7% |
| 2019 | 581,024 | 3.4% | 96.6% |
| 2018 | 581,836 | 3.5% | 96.5% |
| 2017 | 583,200 | 3.6% | 96.4% |
| 2016 | 583,029 | 3.6% | 96.4% |
| 2015 | 579,679 | 3.6% | 96.4% |
| 2014 | 575,251 | 3.4% | 96.6% |
| 2013 | 570,134 | 3.3% | 96.7% |
| 2012 | 562,803 | 3.2% | 96.8% |
| 2011 | 554,697 | 3.1% | 96.9% |
| 2010 | 545,579 | 3.1% | 96.9% |
Nativity & Citizenship FAQs for Wyoming
Approximately 3.5% of residents in Wyoming were born outside the United States.
The vast majority of residents, roughly 98.1%, are U.S. citizens (including both native-born and naturalized citizens).