Laramie County, Wyoming Nativity & Citizenship Status (2024)
Place of birth and citizenship status analysis for Laramie County, Wyoming
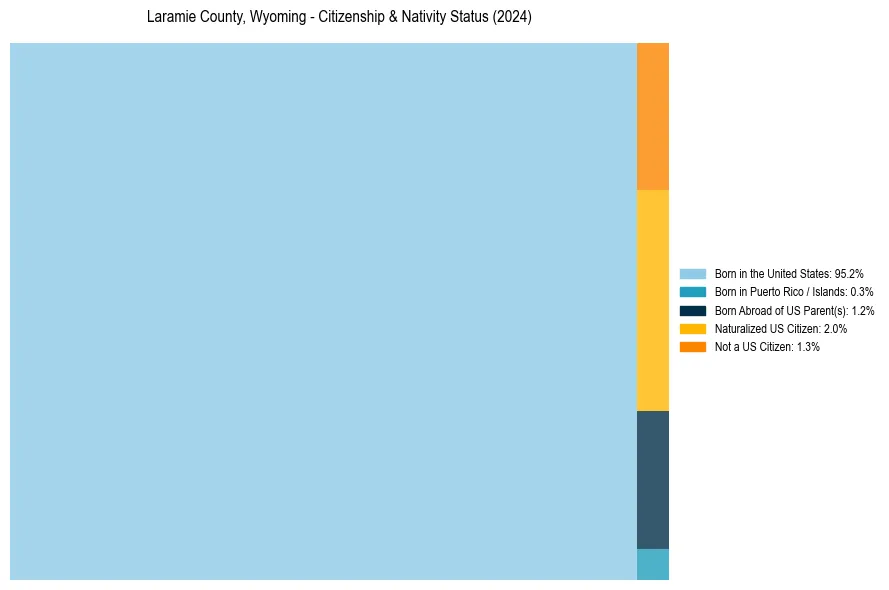
Laramie County, Wyoming Nativity & Citizenship Indicators (2024)
Native Born
96.7%
Foreign Born
3.3%
Naturalized
2.0%
US Citizens
98.7%
Laramie County, Wyoming Nativity & Citizenship Distribution
Laramie County, Wyoming Historical Nativity Trends (2010–2024)
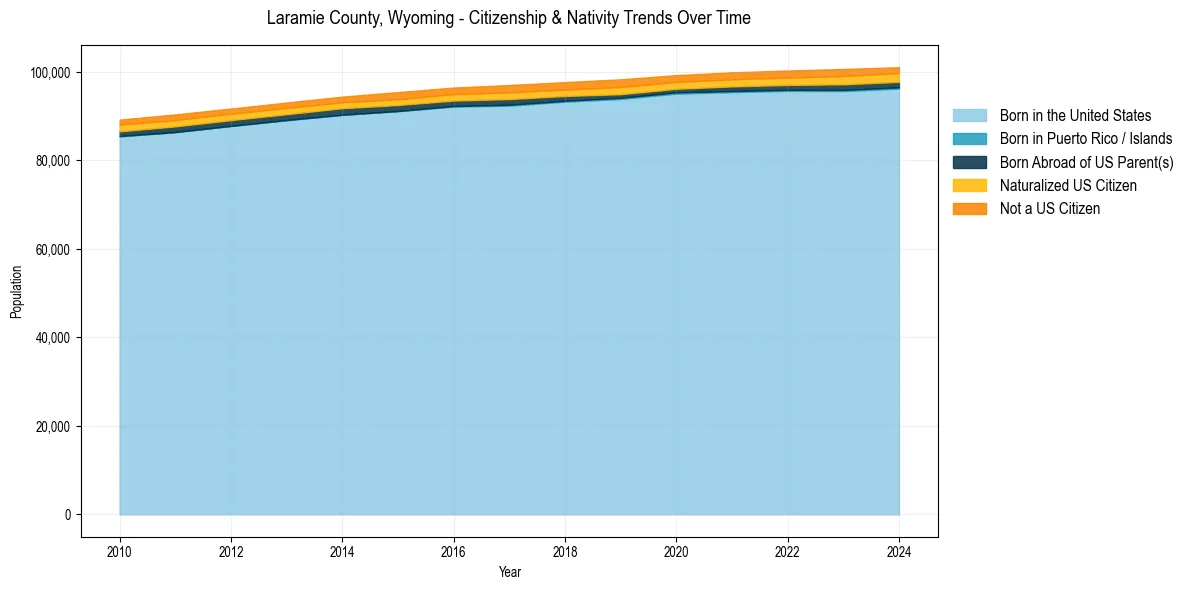
Laramie County, Wyoming Population & Nativity History
| Year | Total Pop | Foreign Born | Native Born |
|---|---|---|---|
| 2024 | 101,060 | 3.3% | 96.7% |
| 2023 | 100,661 | 3.4% | 96.6% |
| 2022 | 100,316 | 3.3% | 96.7% |
| 2021 | 99,905 | 3.2% | 96.8% |
| 2020 | 99,272 | 3.1% | 96.9% |
| 2019 | 98,320 | 3.4% | 96.6% |
| 2018 | 97,692 | 3.2% | 96.8% |
| 2017 | 97,031 | 3.3% | 96.7% |
| 2016 | 96,459 | 3.1% | 96.9% |
| 2015 | 95,431 | 3.1% | 96.9% |
| 2014 | 94,412 | 2.8% | 97.2% |
| 2013 | 93,073 | 2.8% | 97.2% |
| 2012 | 91,719 | 2.9% | 97.1% |
| 2011 | 90,394 | 3.0% | 97.0% |
| 2010 | 89,221 | 3.0% | 97.0% |
Nativity & Citizenship FAQs for Laramie County, Wyoming
Approximately 3.3% of residents in Laramie County, Wyoming were born outside the United States.
The vast majority of residents, roughly 98.7%, are U.S. citizens (including both native-born and naturalized citizens).