Waukesha County, Wisconsin Nativity & Citizenship Status (2024)
Place of birth and citizenship status analysis for Waukesha County, Wisconsin
Waukesha County, Wisconsin Nativity & Citizenship Indicators (2024)
Native Born
94.5%
Foreign Born
5.5%
Naturalized
3.2%
US Citizens
97.7%
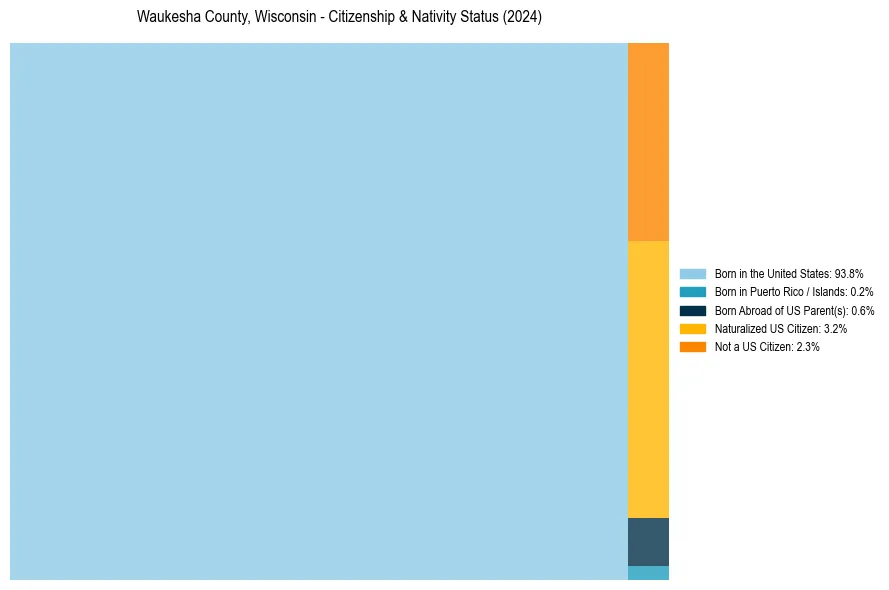
Waukesha County, Wisconsin Nativity & Citizenship Distribution
Waukesha County, Wisconsin Historical Nativity Trends (2010–2024)
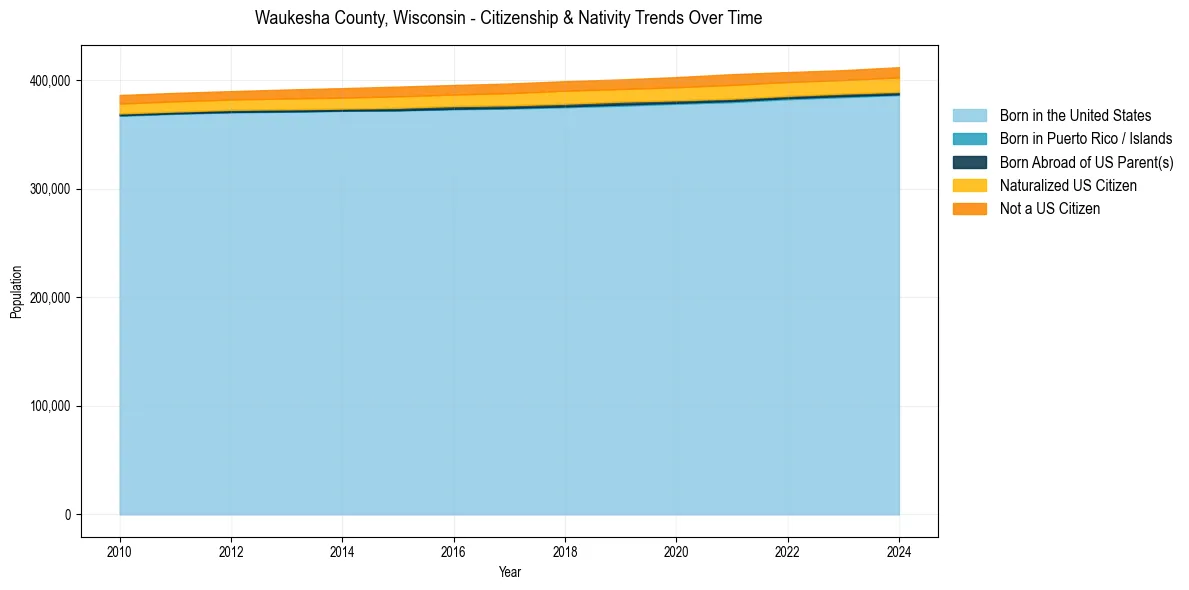
Waukesha County, Wisconsin Population & Nativity History
| Year | Total Pop | Foreign Born | Native Born |
|---|---|---|---|
| 2024 | 411,762 | 5.5% | 94.5% |
| 2023 | 409,040 | 5.3% | 94.7% |
| 2022 | 407,290 | 5.4% | 94.6% |
| 2021 | 405,332 | 5.6% | 94.4% |
| 2020 | 402,637 | 5.3% | 94.7% |
| 2019 | 400,475 | 5.1% | 94.9% |
| 2018 | 398,879 | 5.2% | 94.8% |
| 2017 | 396,731 | 5.1% | 94.9% |
| 2016 | 395,377 | 4.9% | 95.1% |
| 2015 | 393,873 | 4.9% | 95.1% |
| 2014 | 392,511 | 4.8% | 95.2% |
| 2013 | 391,200 | 4.6% | 95.4% |
| 2012 | 389,740 | 4.4% | 95.6% |
| 2011 | 388,125 | 4.4% | 95.6% |
| 2010 | 386,130 | 4.4% | 95.6% |
Nativity & Citizenship FAQs for Waukesha County, Wisconsin
Approximately 5.5% of residents in Waukesha County, Wisconsin were born outside the United States.
The vast majority of residents, roughly 97.7%, are U.S. citizens (including both native-born and naturalized citizens).