Racine County, Wisconsin Nativity & Citizenship Status (2024)
Place of birth and citizenship status analysis for Racine County, Wisconsin
Racine County, Wisconsin Nativity & Citizenship Indicators (2024)
Native Born
95.1%
Foreign Born
4.9%
Naturalized
2.2%
US Citizens
97.3%
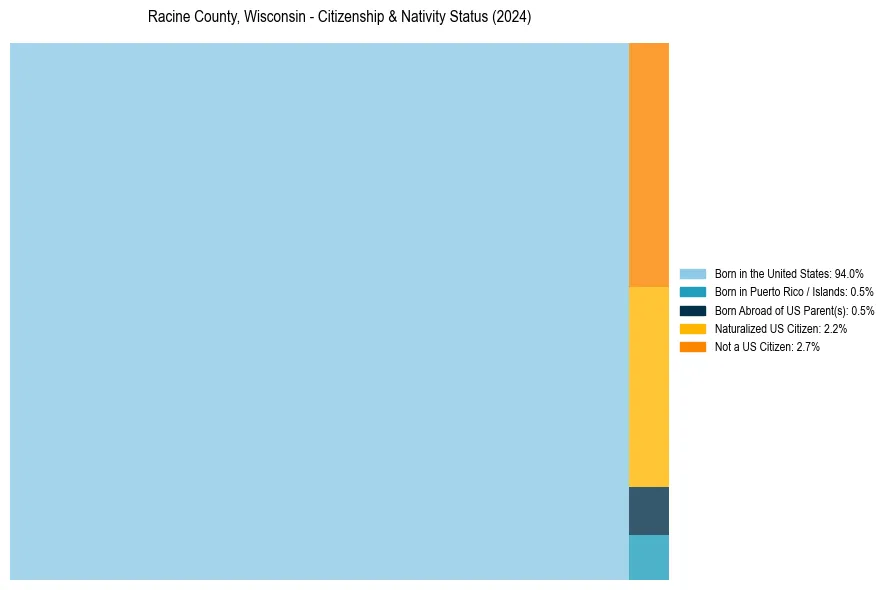
Racine County, Wisconsin Nativity & Citizenship Distribution
Racine County, Wisconsin Historical Nativity Trends (2010–2024)
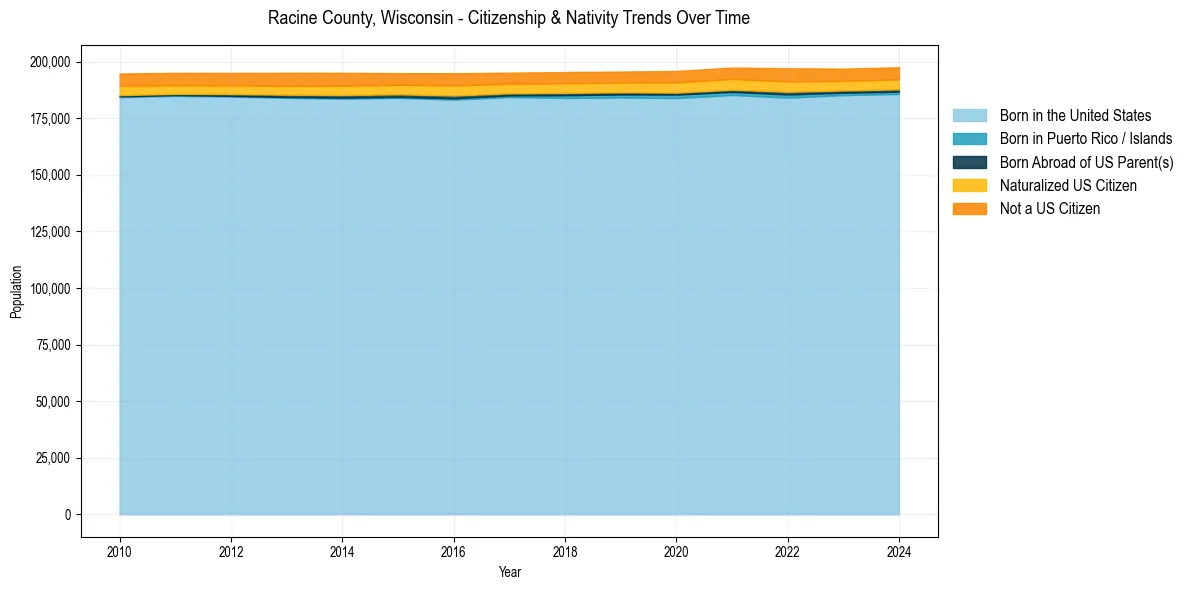
Racine County, Wisconsin Population & Nativity History
| Year | Total Pop | Foreign Born | Native Born |
|---|---|---|---|
| 2024 | 197,532 | 4.9% | 95.1% |
| 2023 | 196,888 | 4.9% | 95.1% |
| 2022 | 197,068 | 5.3% | 94.7% |
| 2021 | 197,379 | 5.0% | 95.0% |
| 2020 | 195,859 | 4.9% | 95.1% |
| 2019 | 195,602 | 4.7% | 95.3% |
| 2018 | 195,398 | 4.7% | 95.3% |
| 2017 | 195,101 | 4.7% | 95.3% |
| 2016 | 194,873 | 5.1% | 94.9% |
| 2015 | 194,895 | 4.8% | 95.2% |
| 2014 | 195,039 | 5.0% | 95.0% |
| 2013 | 195,045 | 5.0% | 95.0% |
| 2012 | 195,024 | 4.8% | 95.2% |
| 2011 | 195,029 | 4.8% | 95.2% |
| 2010 | 194,736 | 4.9% | 95.1% |
Nativity & Citizenship FAQs for Racine County, Wisconsin
Approximately 4.9% of residents in Racine County, Wisconsin were born outside the United States.
The vast majority of residents, roughly 97.3%, are U.S. citizens (including both native-born and naturalized citizens).