Outagamie County, Wisconsin Nativity & Citizenship Status (2024)
Place of birth and citizenship status analysis for Outagamie County, Wisconsin
Outagamie County, Wisconsin Nativity & Citizenship Indicators (2024)
Native Born
95.7%
Foreign Born
4.3%
Naturalized
2.3%
US Citizens
98.0%
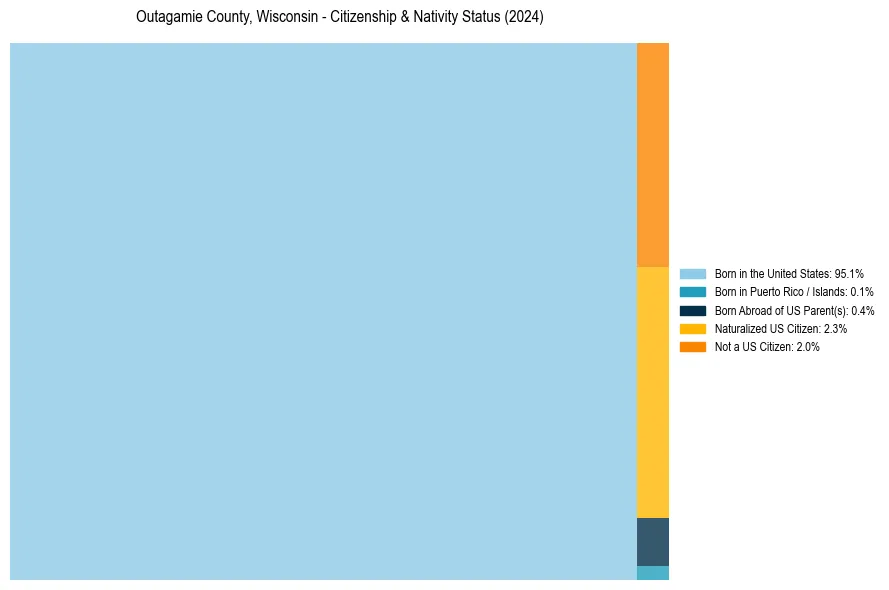
Outagamie County, Wisconsin Nativity & Citizenship Distribution
Outagamie County, Wisconsin Historical Nativity Trends (2010–2024)
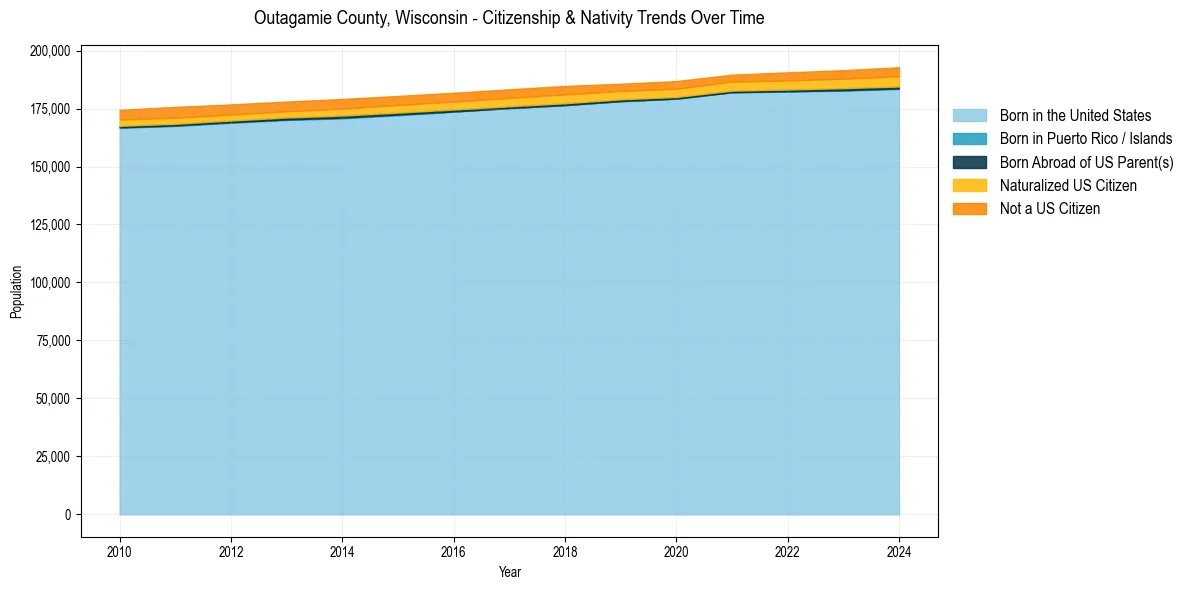
Outagamie County, Wisconsin Population & Nativity History
| Year | Total Pop | Foreign Born | Native Born |
|---|---|---|---|
| 2024 | 192,826 | 4.3% | 95.7% |
| 2023 | 191,537 | 4.0% | 96.0% |
| 2022 | 190,611 | 3.9% | 96.1% |
| 2021 | 189,620 | 3.6% | 96.4% |
| 2020 | 186,829 | 3.7% | 96.3% |
| 2019 | 185,700 | 3.6% | 96.4% |
| 2018 | 184,754 | 4.0% | 96.0% |
| 2017 | 183,288 | 4.0% | 96.0% |
| 2016 | 181,799 | 4.0% | 96.0% |
| 2015 | 180,430 | 4.0% | 96.0% |
| 2014 | 179,139 | 4.0% | 96.0% |
| 2013 | 178,013 | 3.9% | 96.1% |
| 2012 | 176,777 | 3.9% | 96.1% |
| 2011 | 175,724 | 4.1% | 95.9% |
| 2010 | 174,457 | 4.0% | 96.0% |
Nativity & Citizenship FAQs for Outagamie County, Wisconsin
Approximately 4.3% of residents in Outagamie County, Wisconsin were born outside the United States.
The vast majority of residents, roughly 98.0%, are U.S. citizens (including both native-born and naturalized citizens).