Milwaukee County, Wisconsin Nativity & Citizenship Status (2024)
Place of birth and citizenship status analysis for Milwaukee County, Wisconsin
Milwaukee County, Wisconsin Nativity & Citizenship Indicators (2024)
Native Born
90.1%
Foreign Born
9.9%
Naturalized
4.5%
US Citizens
94.6%
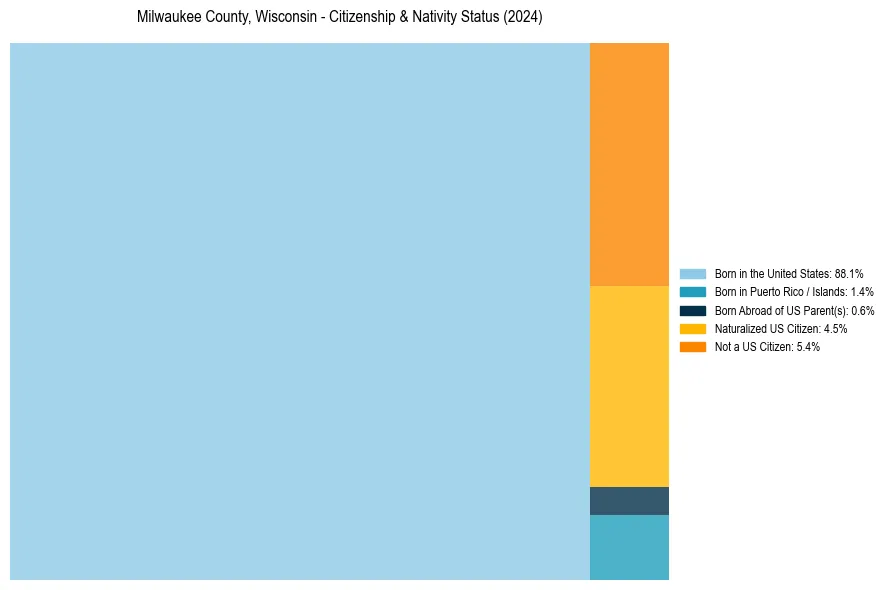
Milwaukee County, Wisconsin Nativity & Citizenship Distribution
Milwaukee County, Wisconsin Historical Nativity Trends (2010–2024)
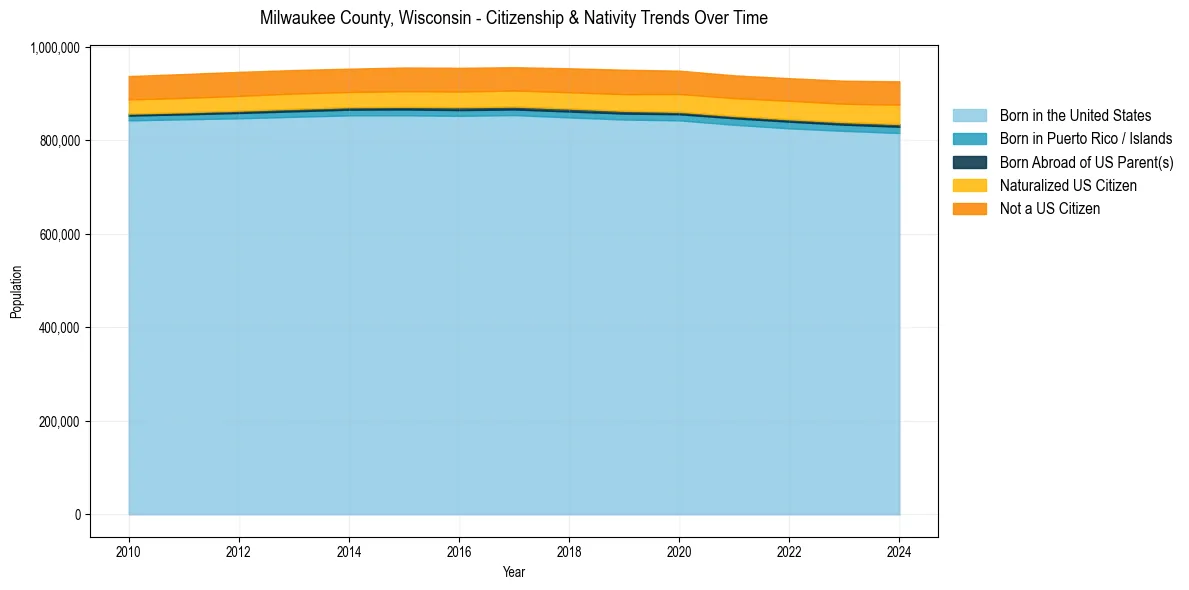
Milwaukee County, Wisconsin Population & Nativity History
| Year | Total Pop | Foreign Born | Native Born |
|---|---|---|---|
| 2024 | 926,331 | 9.9% | 90.1% |
| 2023 | 927,656 | 9.6% | 90.4% |
| 2022 | 933,063 | 9.4% | 90.6% |
| 2021 | 939,123 | 9.2% | 90.8% |
| 2020 | 949,180 | 9.3% | 90.7% |
| 2019 | 951,226 | 9.3% | 90.7% |
| 2018 | 954,209 | 9.0% | 91.0% |
| 2017 | 956,586 | 8.8% | 91.2% |
| 2016 | 955,306 | 8.8% | 91.2% |
| 2015 | 955,939 | 8.8% | 91.2% |
| 2014 | 953,401 | 8.6% | 91.4% |
| 2013 | 950,527 | 8.7% | 91.3% |
| 2012 | 946,584 | 8.8% | 91.2% |
| 2011 | 942,006 | 8.7% | 91.3% |
| 2010 | 937,616 | 8.6% | 91.4% |
Nativity & Citizenship FAQs for Milwaukee County, Wisconsin
Approximately 9.9% of residents in Milwaukee County, Wisconsin were born outside the United States.
The vast majority of residents, roughly 94.6%, are U.S. citizens (including both native-born and naturalized citizens).