Kenosha County, Wisconsin Nativity & Citizenship Status (2024)
Place of birth and citizenship status analysis for Kenosha County, Wisconsin
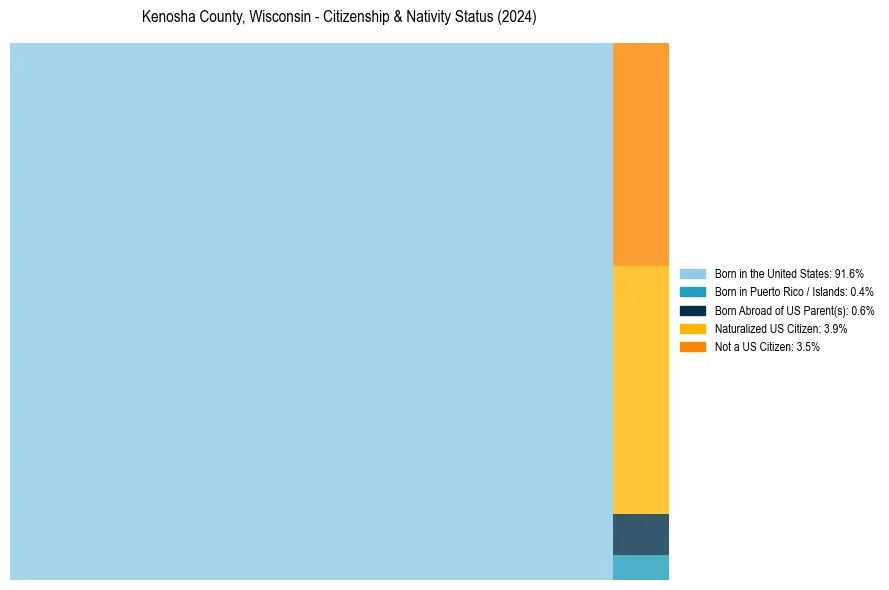
Kenosha County, Wisconsin Nativity & Citizenship Indicators (2024)
Native Born
92.6%
Foreign Born
7.4%
Naturalized
3.9%
US Citizens
96.5%
Kenosha County, Wisconsin Nativity & Citizenship Distribution
Kenosha County, Wisconsin Historical Nativity Trends (2010–2024)
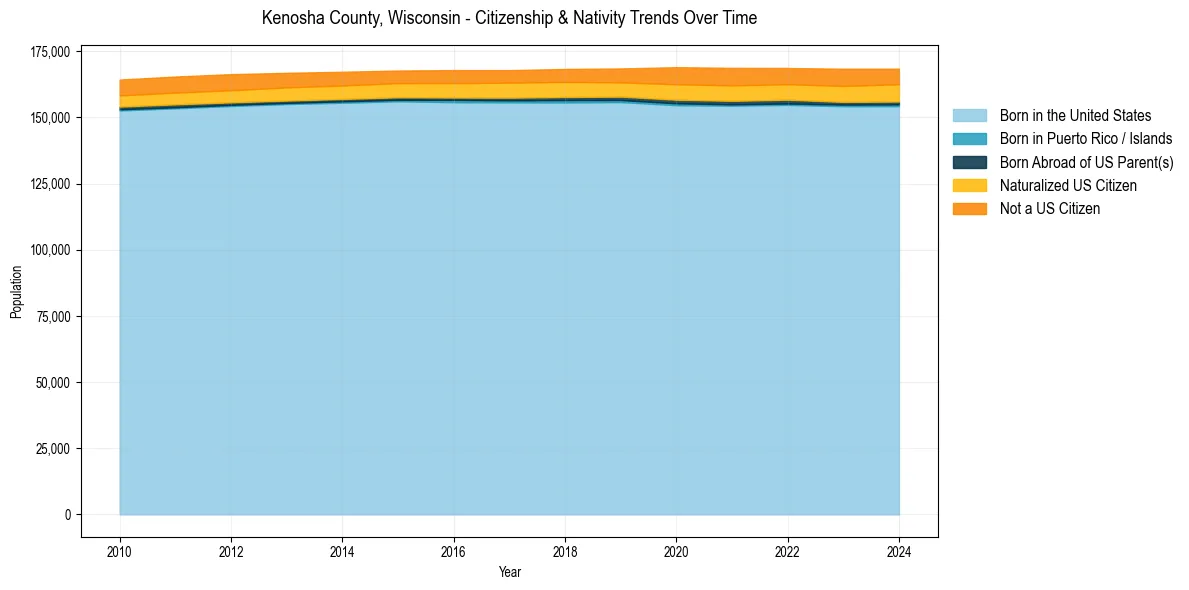
Kenosha County, Wisconsin Population & Nativity History
| Year | Total Pop | Foreign Born | Native Born |
|---|---|---|---|
| 2024 | 168,438 | 7.4% | 92.6% |
| 2023 | 168,413 | 7.4% | 92.6% |
| 2022 | 168,693 | 7.1% | 92.9% |
| 2021 | 168,743 | 7.4% | 92.6% |
| 2020 | 168,998 | 7.3% | 92.7% |
| 2019 | 168,524 | 6.3% | 93.7% |
| 2018 | 168,330 | 6.3% | 93.7% |
| 2017 | 167,886 | 6.2% | 93.8% |
| 2016 | 167,896 | 6.2% | 93.8% |
| 2015 | 167,738 | 6.0% | 94.0% |
| 2014 | 167,268 | 6.1% | 93.9% |
| 2013 | 166,874 | 6.3% | 93.7% |
| 2012 | 166,373 | 6.4% | 93.6% |
| 2011 | 165,467 | 6.4% | 93.6% |
| 2010 | 164,328 | 6.2% | 93.8% |
Nativity & Citizenship FAQs for Kenosha County, Wisconsin
Approximately 7.4% of residents in Kenosha County, Wisconsin were born outside the United States.
The vast majority of residents, roughly 96.5%, are U.S. citizens (including both native-born and naturalized citizens).