Eau Claire County, Wisconsin Nativity & Citizenship Status (2024)
Place of birth and citizenship status analysis for Eau Claire County, Wisconsin
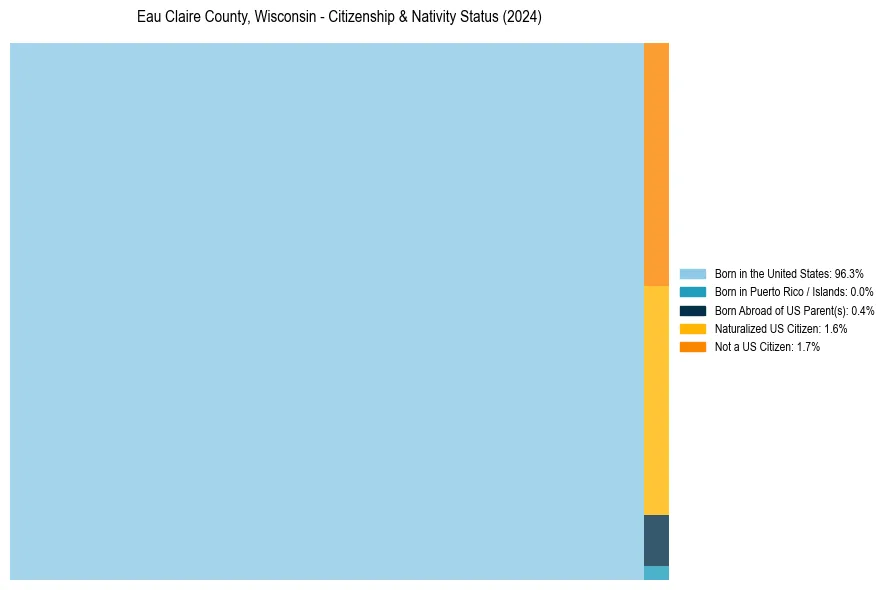
Eau Claire County, Wisconsin Nativity & Citizenship Indicators (2024)
Native Born
96.7%
Foreign Born
3.3%
Naturalized
1.6%
US Citizens
98.3%
Eau Claire County, Wisconsin Nativity & Citizenship Distribution
Eau Claire County, Wisconsin Historical Nativity Trends (2010–2024)
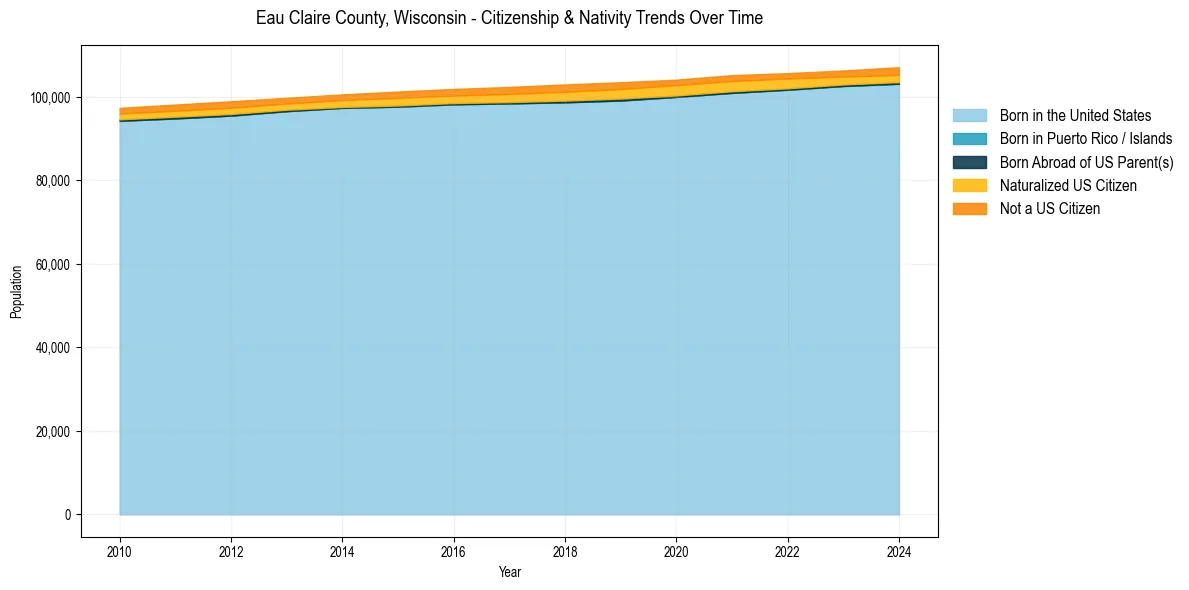
Eau Claire County, Wisconsin Population & Nativity History
| Year | Total Pop | Foreign Born | Native Born |
|---|---|---|---|
| 2024 | 107,116 | 3.3% | 96.7% |
| 2023 | 106,328 | 3.2% | 96.8% |
| 2022 | 105,697 | 3.4% | 96.6% |
| 2021 | 105,206 | 3.7% | 96.3% |
| 2020 | 104,132 | 3.6% | 96.4% |
| 2019 | 103,514 | 3.8% | 96.2% |
| 2018 | 102,991 | 3.8% | 96.2% |
| 2017 | 102,388 | 3.6% | 96.4% |
| 2016 | 101,907 | 3.3% | 96.7% |
| 2015 | 101,281 | 3.3% | 96.7% |
| 2014 | 100,607 | 3.0% | 97.0% |
| 2013 | 99,788 | 2.9% | 97.1% |
| 2012 | 98,952 | 3.1% | 96.9% |
| 2011 | 98,168 | 3.0% | 97.0% |
| 2010 | 97,381 | 2.8% | 97.2% |
Nativity & Citizenship FAQs for Eau Claire County, Wisconsin
Approximately 3.3% of residents in Eau Claire County, Wisconsin were born outside the United States.
The vast majority of residents, roughly 98.3%, are U.S. citizens (including both native-born and naturalized citizens).