West Virginia Nativity & Citizenship Status (2024)
Place of birth and citizenship status analysis for West Virginia
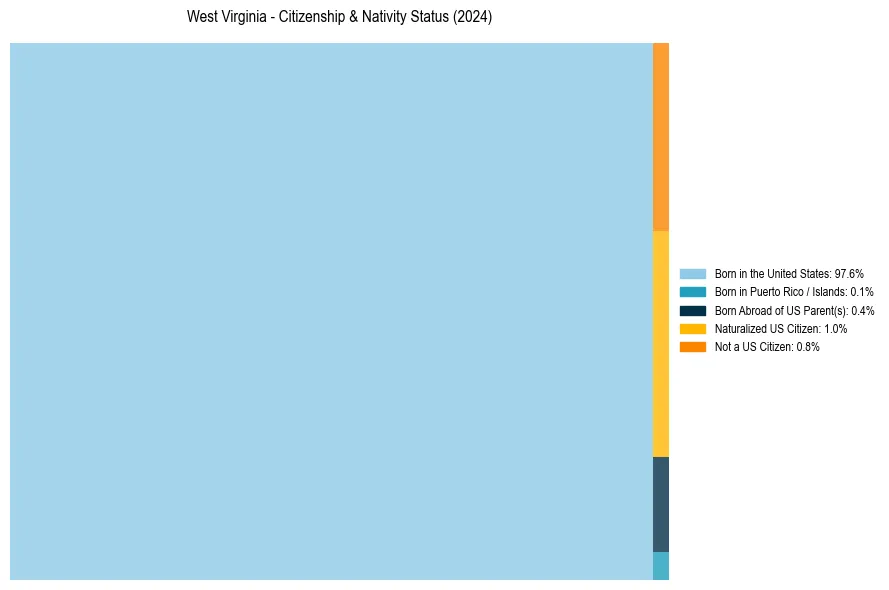
West Virginia Nativity & Citizenship Indicators (2024)
Native Born
98.2%
Foreign Born
1.8%
Naturalized
1.0%
US Citizens
99.2%
West Virginia Nativity & Citizenship Distribution
West Virginia Historical Nativity Trends (2010–2024)
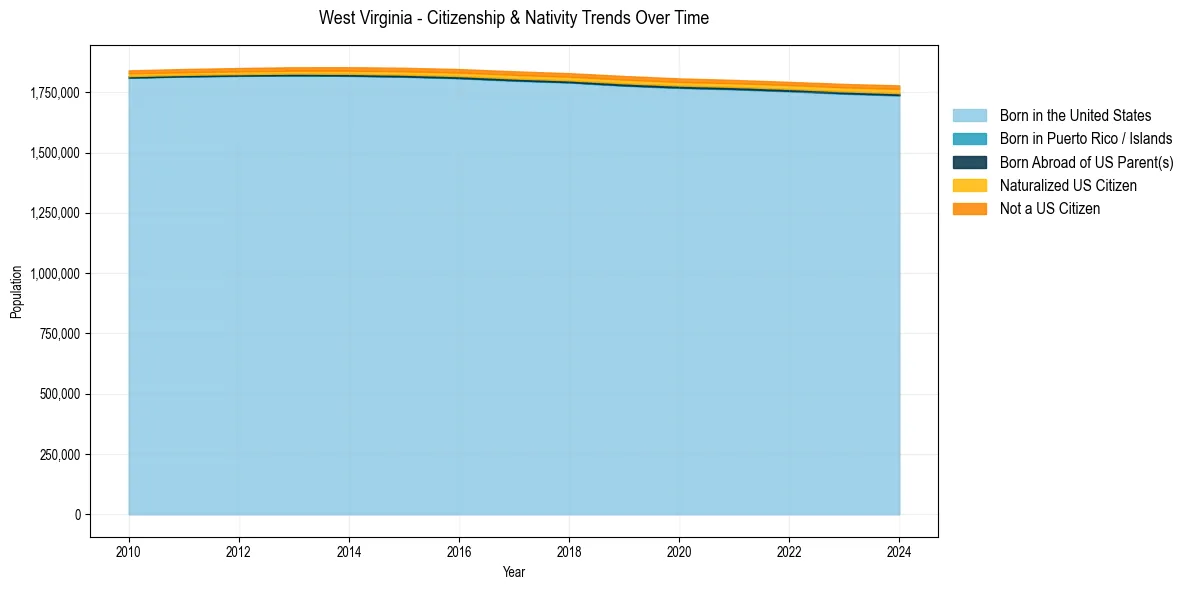
West Virginia Population & Nativity History
| Year | Total Pop | Foreign Born | Native Born |
|---|---|---|---|
| 2024 | 1,778,373 | 1.8% | 98.2% |
| 2023 | 1,784,462 | 1.7% | 98.3% |
| 2022 | 1,792,967 | 1.6% | 98.4% |
| 2021 | 1,801,049 | 1.6% | 98.4% |
| 2020 | 1,807,426 | 1.6% | 98.4% |
| 2019 | 1,817,305 | 1.7% | 98.3% |
| 2018 | 1,829,054 | 1.6% | 98.4% |
| 2017 | 1,836,843 | 1.6% | 98.4% |
| 2016 | 1,846,092 | 1.6% | 98.4% |
| 2015 | 1,851,420 | 1.5% | 98.5% |
| 2014 | 1,853,881 | 1.5% | 98.5% |
| 2013 | 1,853,619 | 1.4% | 98.6% |
| 2012 | 1,850,481 | 1.4% | 98.6% |
| 2011 | 1,846,372 | 1.3% | 98.7% |
| 2010 | 1,840,802 | 1.3% | 98.7% |
Nativity & Citizenship FAQs for West Virginia
Approximately 1.8% of residents in West Virginia were born outside the United States.
The vast majority of residents, roughly 99.2%, are U.S. citizens (including both native-born and naturalized citizens).