Monongalia County, West Virginia Nativity & Citizenship Status (2024)
Place of birth and citizenship status analysis for Monongalia County, West Virginia
Monongalia County, West Virginia Nativity & Citizenship Indicators (2024)
Native Born
94.6%
Foreign Born
5.4%
Naturalized
2.5%
US Citizens
97.2%
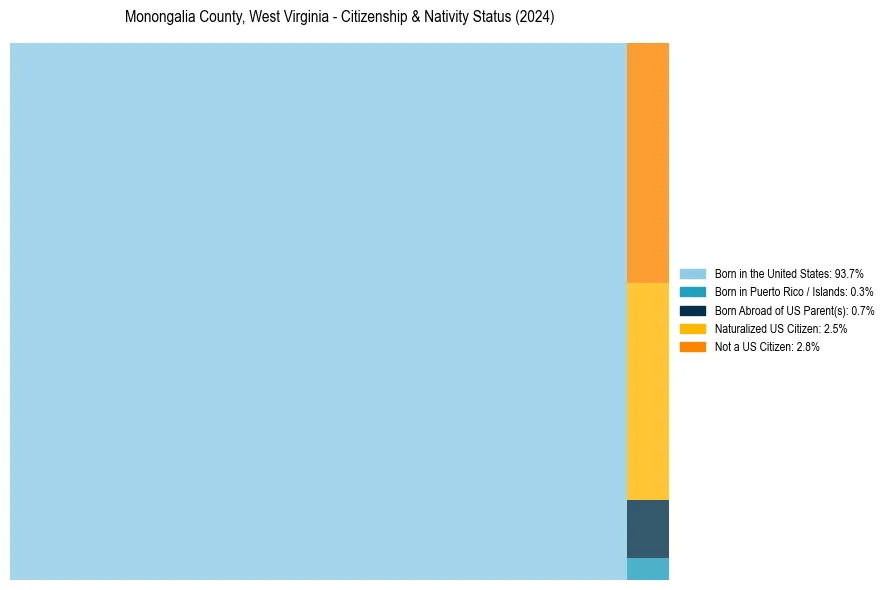
Monongalia County, West Virginia Nativity & Citizenship Distribution
Monongalia County, West Virginia Historical Nativity Trends (2010–2024)
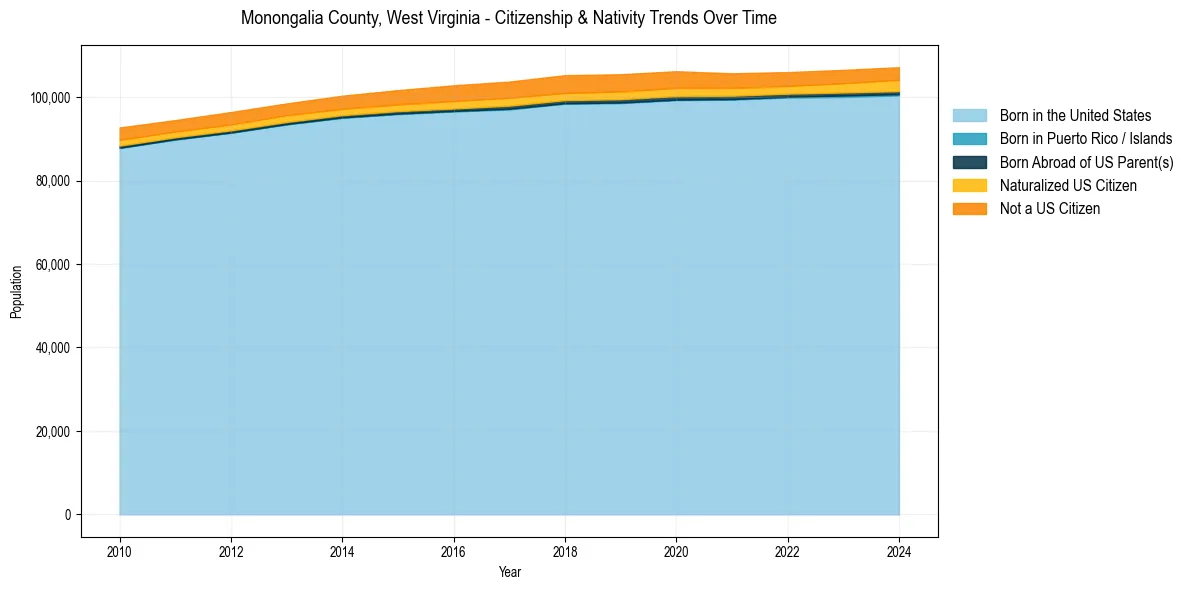
Monongalia County, West Virginia Population & Nativity History
| Year | Total Pop | Foreign Born | Native Born |
|---|---|---|---|
| 2024 | 107,163 | 5.4% | 94.6% |
| 2023 | 106,520 | 5.1% | 94.9% |
| 2022 | 105,988 | 4.9% | 95.1% |
| 2021 | 105,695 | 5.1% | 94.9% |
| 2020 | 106,196 | 5.6% | 94.4% |
| 2019 | 105,474 | 5.7% | 94.3% |
| 2018 | 105,252 | 5.7% | 94.3% |
| 2017 | 103,715 | 5.6% | 94.4% |
| 2016 | 102,827 | 5.4% | 94.6% |
| 2015 | 101,668 | 5.0% | 95.0% |
| 2014 | 100,332 | 4.6% | 95.4% |
| 2013 | 98,483 | 4.5% | 95.5% |
| 2012 | 96,417 | 4.6% | 95.4% |
| 2011 | 94,489 | 4.4% | 95.6% |
| 2010 | 92,715 | 4.7% | 95.3% |
Nativity & Citizenship FAQs for Monongalia County, West Virginia
Approximately 5.4% of residents in Monongalia County, West Virginia were born outside the United States.
The vast majority of residents, roughly 97.2%, are U.S. citizens (including both native-born and naturalized citizens).