Lincoln County, West Virginia Nativity & Citizenship Status (2024)
Place of birth and citizenship status analysis for Lincoln County, West Virginia
Lincoln County, West Virginia Nativity & Citizenship Indicators (2024)
Native Born
99.5%
Foreign Born
0.5%
Naturalized
0.2%
US Citizens
99.8%
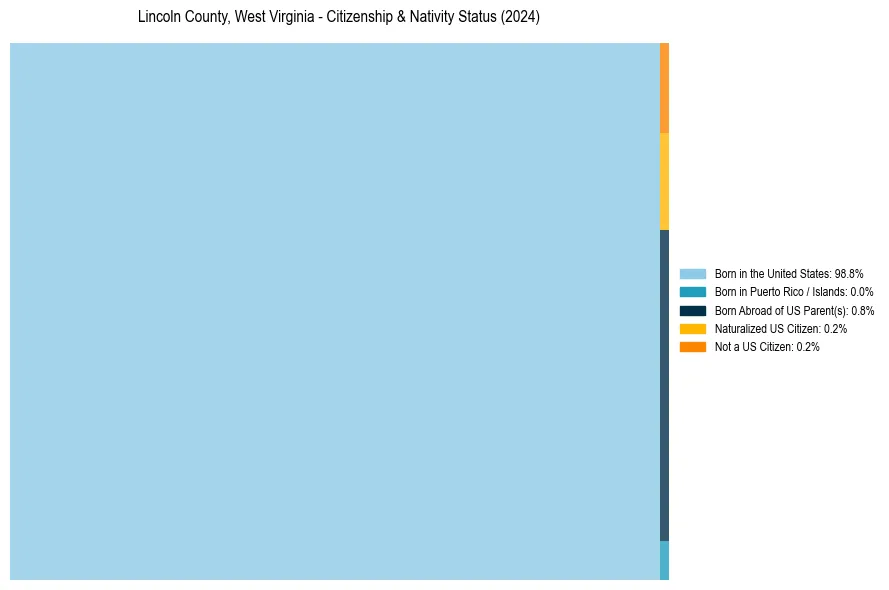
Lincoln County, West Virginia Nativity & Citizenship Distribution
Lincoln County, West Virginia Historical Nativity Trends (2010–2024)
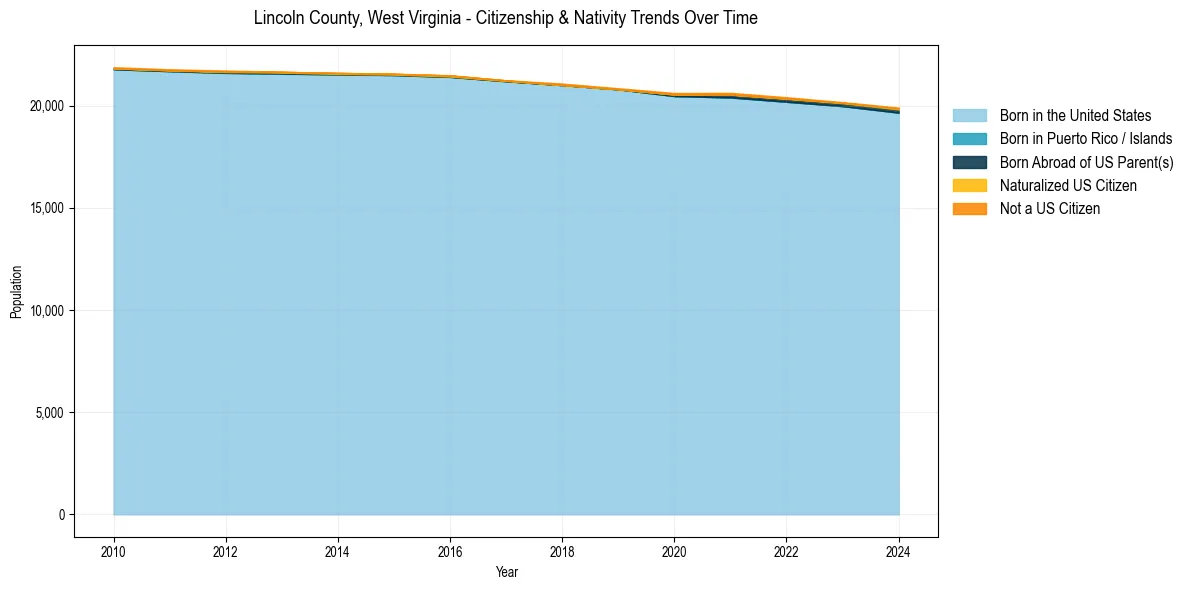
Lincoln County, West Virginia Population & Nativity History
| Year | Total Pop | Foreign Born | Native Born |
|---|---|---|---|
| 2024 | 19,902 | 0.5% | 99.5% |
| 2023 | 20,170 | 0.3% | 99.7% |
| 2022 | 20,410 | 0.4% | 99.6% |
| 2021 | 20,625 | 0.4% | 99.6% |
| 2020 | 20,617 | 0.4% | 99.6% |
| 2019 | 20,850 | 0.3% | 99.7% |
| 2018 | 21,078 | 0.4% | 99.6% |
| 2017 | 21,241 | 0.2% | 99.8% |
| 2016 | 21,482 | 0.3% | 99.7% |
| 2015 | 21,560 | 0.2% | 99.8% |
| 2014 | 21,599 | 0.2% | 99.8% |
| 2013 | 21,660 | 0.2% | 99.8% |
| 2012 | 21,714 | 0.3% | 99.7% |
| 2011 | 21,777 | 0.3% | 99.7% |
| 2010 | 21,879 | 0.3% | 99.7% |
Nativity & Citizenship FAQs for Lincoln County, West Virginia
Approximately 0.5% of residents in Lincoln County, West Virginia were born outside the United States.
The vast majority of residents, roughly 99.8%, are U.S. citizens (including both native-born and naturalized citizens).