Berkeley County, West Virginia Nativity & Citizenship Status (2024)
Place of birth and citizenship status analysis for Berkeley County, West Virginia
Berkeley County, West Virginia Nativity & Citizenship Indicators (2024)
Native Born
95.0%
Foreign Born
5.0%
Naturalized
3.2%
US Citizens
98.2%
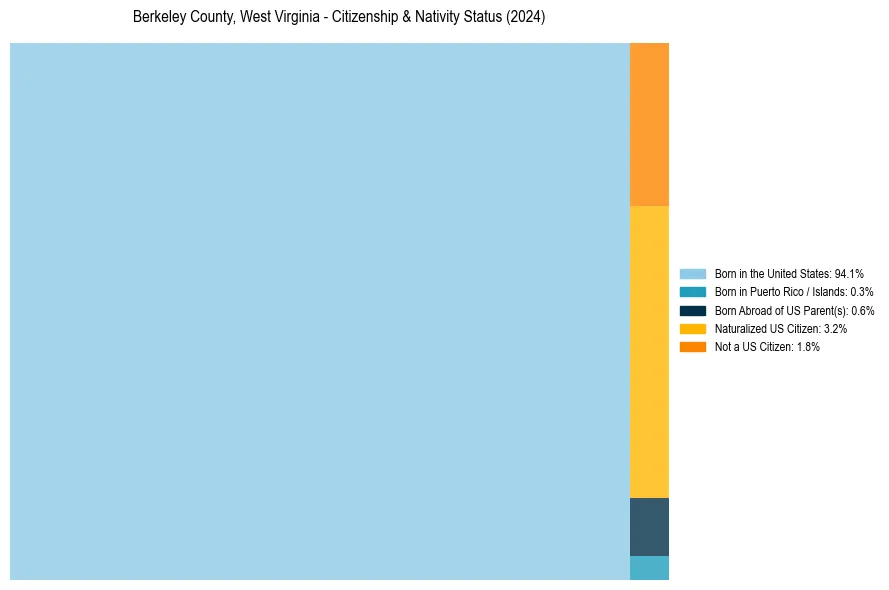
Berkeley County, West Virginia Nativity & Citizenship Distribution
Berkeley County, West Virginia Historical Nativity Trends (2010–2024)
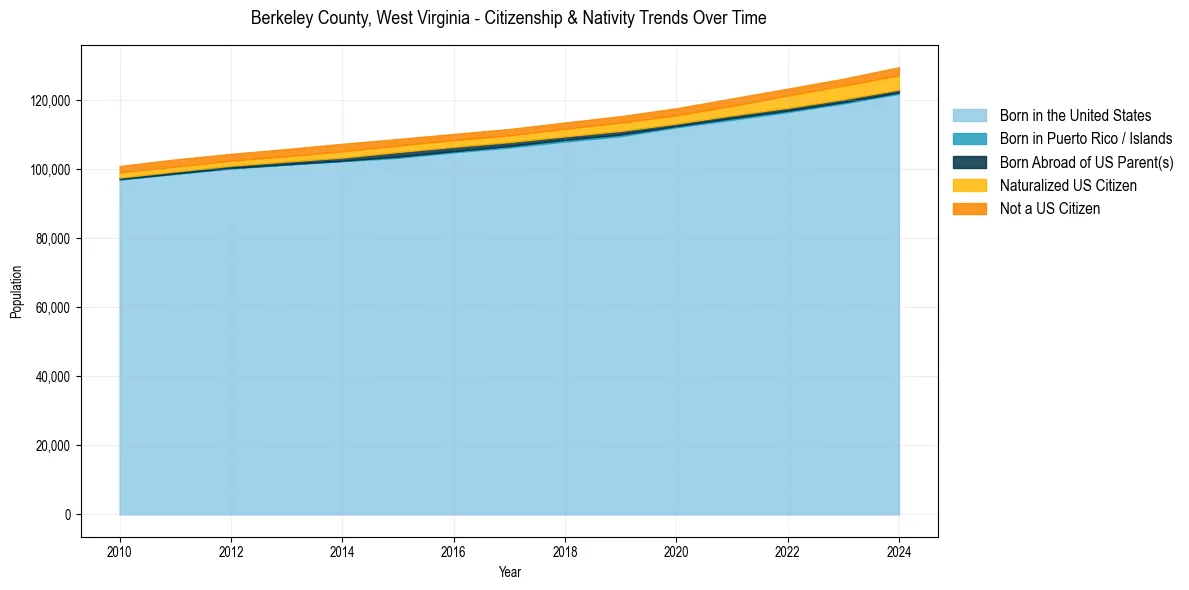
Berkeley County, West Virginia Population & Nativity History
| Year | Total Pop | Foreign Born | Native Born |
|---|---|---|---|
| 2024 | 129,514 | 5.0% | 95.0% |
| 2023 | 126,165 | 4.7% | 95.3% |
| 2022 | 123,283 | 4.5% | 95.5% |
| 2021 | 120,460 | 4.1% | 95.9% |
| 2020 | 117,615 | 3.8% | 96.2% |
| 2019 | 115,329 | 3.7% | 96.3% |
| 2018 | 113,495 | 3.5% | 96.5% |
| 2017 | 111,610 | 3.4% | 96.6% |
| 2016 | 110,173 | 3.4% | 96.6% |
| 2015 | 108,724 | 3.5% | 96.5% |
| 2014 | 107,324 | 3.7% | 96.3% |
| 2013 | 105,812 | 3.4% | 96.6% |
| 2012 | 104,410 | 3.3% | 96.7% |
| 2011 | 102,801 | 3.4% | 96.6% |
| 2010 | 100,910 | 3.3% | 96.7% |
Nativity & Citizenship FAQs for Berkeley County, West Virginia
Approximately 5.0% of residents in Berkeley County, West Virginia were born outside the United States.
The vast majority of residents, roughly 98.2%, are U.S. citizens (including both native-born and naturalized citizens).