Spotsylvania County, Virginia Nativity & Citizenship Status (2024)
Place of birth and citizenship status analysis for Spotsylvania County, Virginia
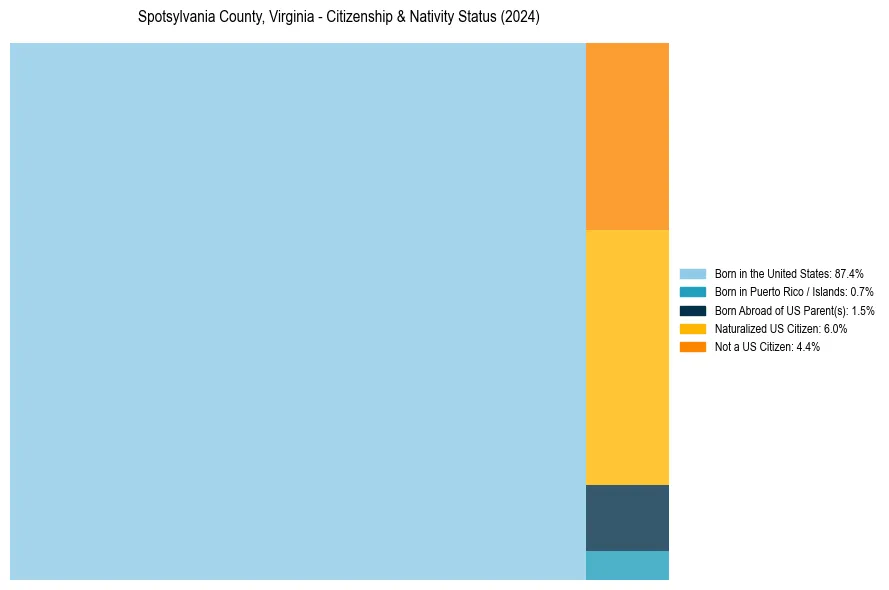
Spotsylvania County, Virginia Nativity & Citizenship Indicators (2024)
Native Born
89.6%
Foreign Born
10.4%
Naturalized
6.0%
US Citizens
95.6%
Spotsylvania County, Virginia Nativity & Citizenship Distribution
Spotsylvania County, Virginia Historical Nativity Trends (2010–2024)
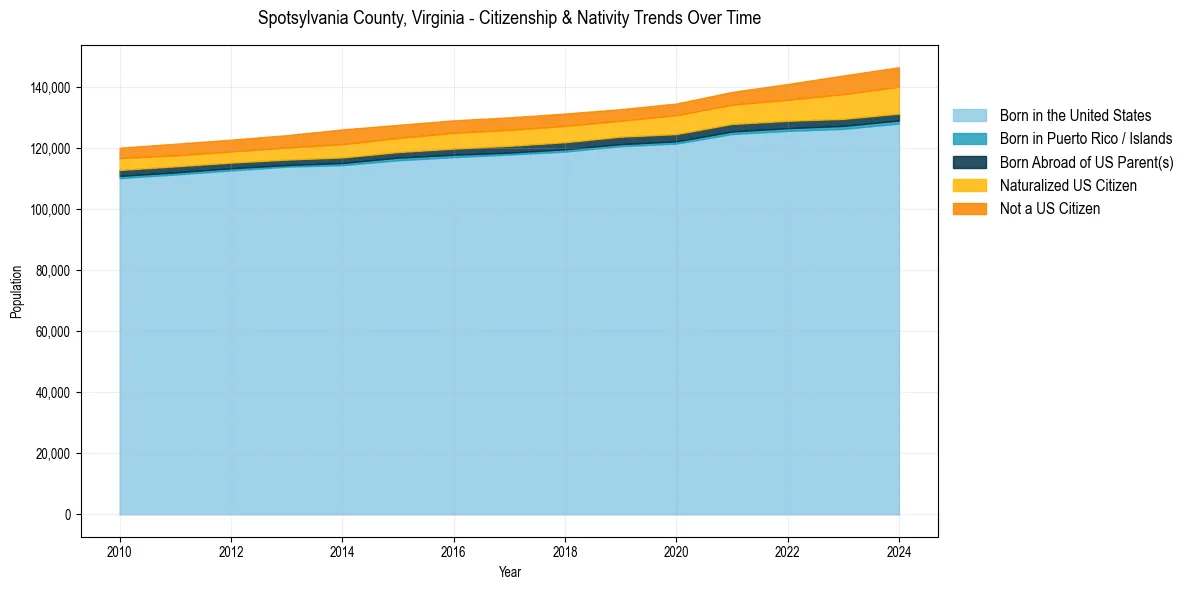
Spotsylvania County, Virginia Population & Nativity History
| Year | Total Pop | Foreign Born | Native Born |
|---|---|---|---|
| 2024 | 146,603 | 10.4% | 89.6% |
| 2023 | 143,876 | 9.9% | 90.1% |
| 2022 | 141,097 | 8.6% | 91.4% |
| 2021 | 138,493 | 7.6% | 92.4% |
| 2020 | 134,683 | 7.4% | 92.6% |
| 2019 | 132,833 | 6.8% | 93.2% |
| 2018 | 131,412 | 7.2% | 92.8% |
| 2017 | 130,159 | 7.2% | 92.8% |
| 2016 | 129,181 | 7.2% | 92.8% |
| 2015 | 127,691 | 7.0% | 93.0% |
| 2014 | 126,200 | 7.3% | 92.7% |
| 2013 | 124,319 | 6.4% | 93.6% |
| 2012 | 122,854 | 6.1% | 93.9% |
| 2011 | 121,508 | 6.1% | 93.9% |
| 2010 | 120,212 | 6.1% | 93.9% |
Nativity & Citizenship FAQs for Spotsylvania County, Virginia
Approximately 10.4% of residents in Spotsylvania County, Virginia were born outside the United States.
The vast majority of residents, roughly 95.6%, are U.S. citizens (including both native-born and naturalized citizens).