Manassas Park city, Virginia Nativity & Citizenship Status (2024)
Place of birth and citizenship status analysis for Manassas Park city, Virginia
Manassas Park city, Virginia Nativity & Citizenship Indicators (2024)
Native Born
63.2%
Foreign Born
36.8%
Naturalized
18.5%
US Citizens
81.7%
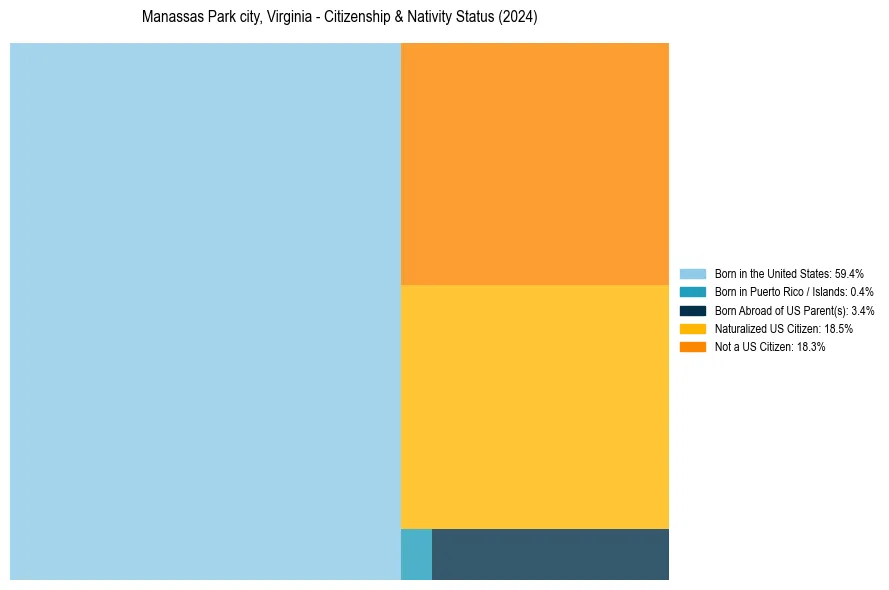
Manassas Park city, Virginia Nativity & Citizenship Distribution
Manassas Park city, Virginia Historical Nativity Trends (2010–2024)
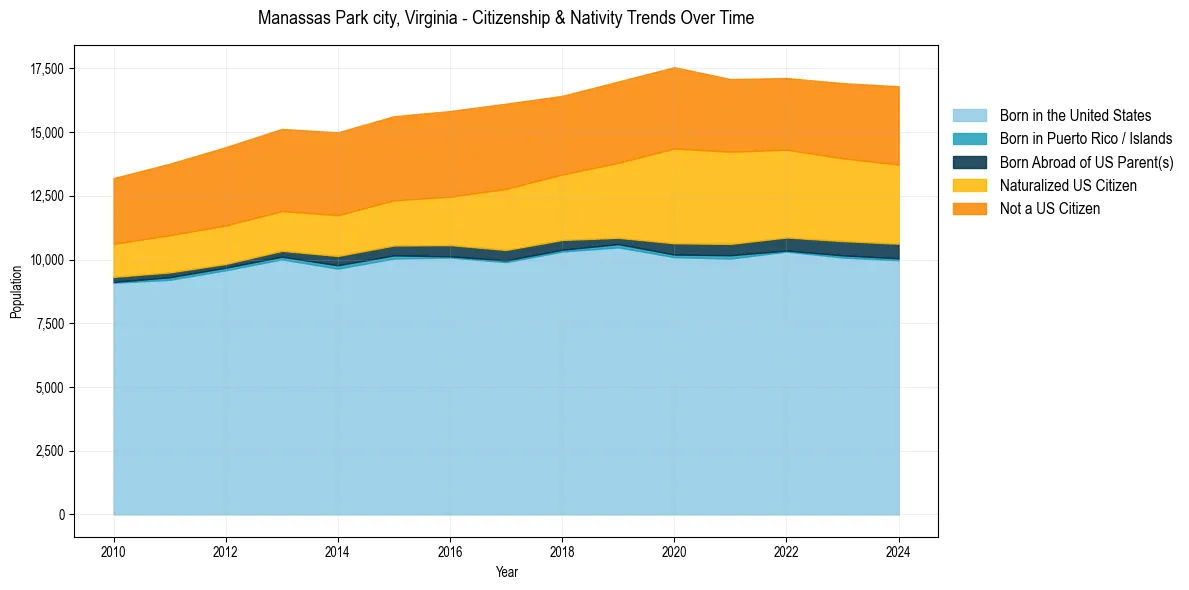
Manassas Park city, Virginia Population & Nativity History
| Year | Total Pop | Foreign Born | Native Born |
|---|---|---|---|
| 2024 | 16,798 | 36.8% | 63.2% |
| 2023 | 16,923 | 36.6% | 63.4% |
| 2022 | 17,123 | 36.5% | 63.5% |
| 2021 | 17,081 | 37.9% | 62.1% |
| 2020 | 17,548 | 39.4% | 60.6% |
| 2019 | 16,986 | 36.1% | 63.9% |
| 2018 | 16,423 | 34.4% | 65.6% |
| 2017 | 16,117 | 35.6% | 64.4% |
| 2016 | 15,827 | 33.2% | 66.8% |
| 2015 | 15,625 | 32.5% | 67.5% |
| 2014 | 14,992 | 32.4% | 67.6% |
| 2013 | 15,125 | 31.6% | 68.4% |
| 2012 | 14,409 | 31.8% | 68.2% |
| 2011 | 13,759 | 31.0% | 69.0% |
| 2010 | 13,195 | 29.4% | 70.6% |
Nativity & Citizenship FAQs for Manassas Park city, Virginia
Approximately 36.8% of residents in Manassas Park city, Virginia were born outside the United States.
The vast majority of residents, roughly 81.7%, are U.S. citizens (including both native-born and naturalized citizens).