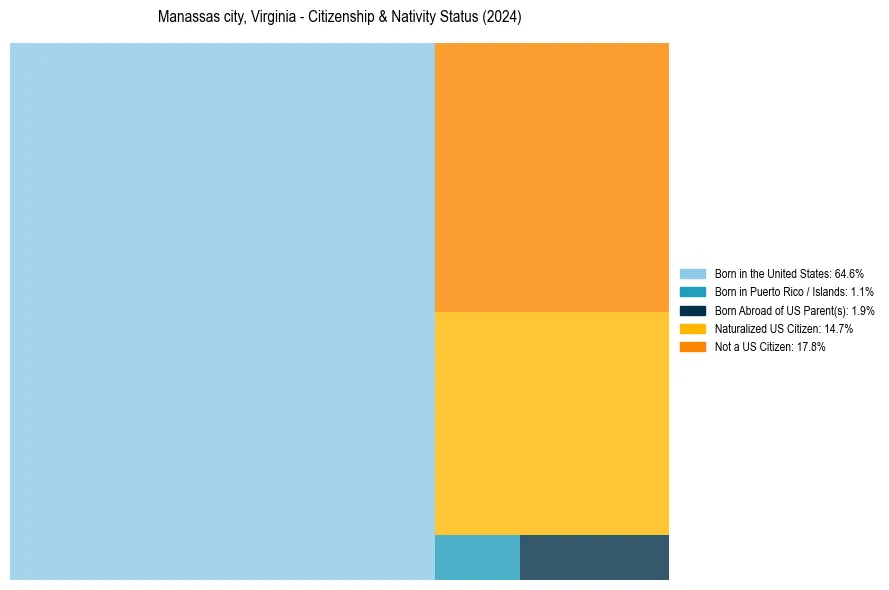
Manassas city, Virginia Nativity & Citizenship Status (2024)
Place of birth and citizenship status analysis for Manassas city, Virginia
Manassas city, Virginia Nativity & Citizenship Indicators (2024)
Native Born
67.6%
Foreign Born
32.4%
Naturalized
14.7%
US Citizens
82.2%
Manassas city, Virginia Nativity & Citizenship Distribution
Manassas city, Virginia Historical Nativity Trends (2010–2024)

Manassas city, Virginia Population & Nativity History
| Year | Total Pop | Foreign Born | Native Born |
|---|---|---|---|
| 2024 | 42,976 | 32.4% | 67.6% |
| 2023 | 42,674 | 31.8% | 68.2% |
| 2022 | 42,620 | 29.4% | 70.6% |
| 2021 | 42,596 | 27.4% | 72.6% |
| 2020 | 41,038 | 26.5% | 73.5% |
| 2019 | 41,174 | 26.2% | 73.8% |
| 2018 | 41,457 | 26.0% | 74.0% |
| 2017 | 41,379 | 26.2% | 73.8% |
| 2016 | 41,149 | 27.7% | 72.3% |
| 2015 | 40,743 | 27.3% | 72.7% |
| 2014 | 40,436 | 26.9% | 73.1% |
| 2013 | 39,317 | 25.5% | 74.5% |
| 2012 | 37,943 | 24.9% | 75.1% |
| 2011 | 36,811 | 24.5% | 75.5% |
| 2010 | 36,067 | 24.7% | 75.3% |
Nativity & Citizenship FAQs for Manassas city, Virginia
Approximately 32.4% of residents in Manassas city, Virginia were born outside the United States.
The vast majority of residents, roughly 82.2%, are U.S. citizens (including both native-born and naturalized citizens).