Louisa County, Virginia Nativity & Citizenship Status (2024)
Place of birth and citizenship status analysis for Louisa County, Virginia
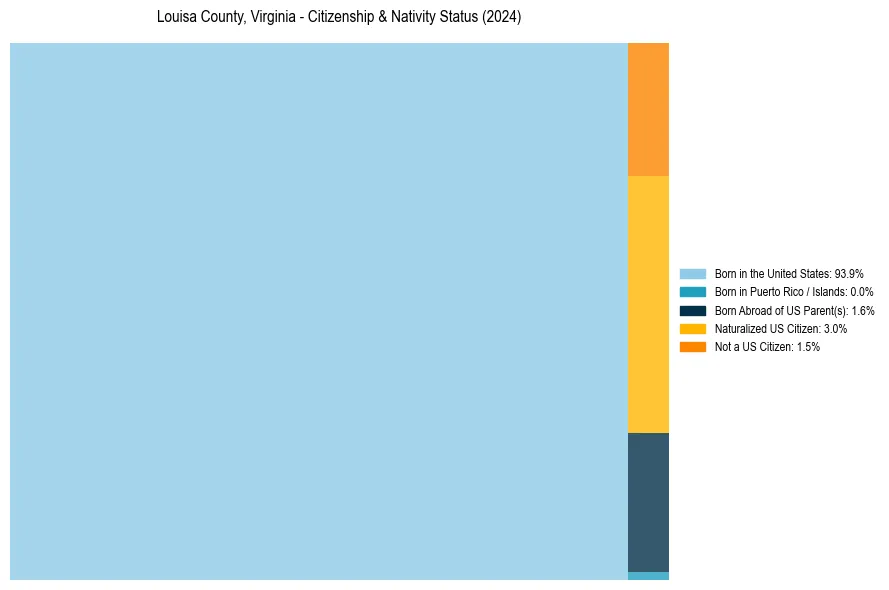
Louisa County, Virginia Nativity & Citizenship Indicators (2024)
Native Born
95.5%
Foreign Born
4.5%
Naturalized
3.0%
US Citizens
98.5%
Louisa County, Virginia Nativity & Citizenship Distribution
Louisa County, Virginia Historical Nativity Trends (2010–2024)
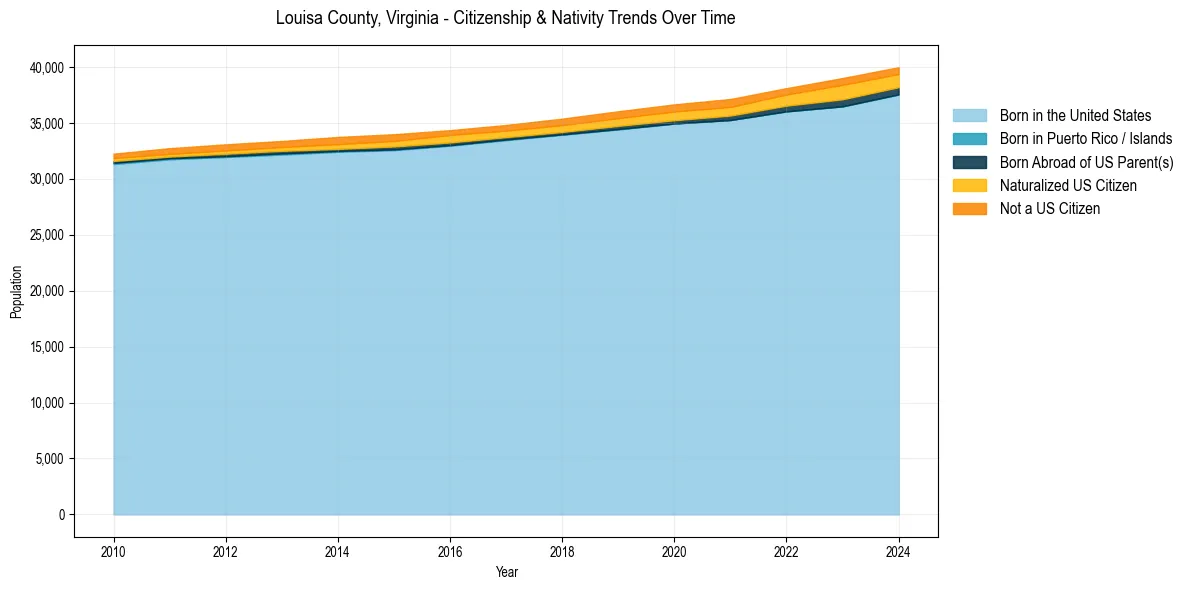
Louisa County, Virginia Population & Nativity History
| Year | Total Pop | Foreign Born | Native Born |
|---|---|---|---|
| 2024 | 39,980 | 4.5% | 95.5% |
| 2023 | 39,012 | 4.9% | 95.1% |
| 2022 | 38,106 | 4.1% | 95.9% |
| 2021 | 37,136 | 4.0% | 96.0% |
| 2020 | 36,654 | 3.9% | 96.1% |
| 2019 | 36,040 | 3.6% | 96.4% |
| 2018 | 35,380 | 3.4% | 96.6% |
| 2017 | 34,813 | 3.1% | 96.9% |
| 2016 | 34,350 | 3.2% | 96.8% |
| 2015 | 33,986 | 3.2% | 96.8% |
| 2014 | 33,743 | 3.2% | 96.8% |
| 2013 | 33,384 | 2.6% | 97.4% |
| 2012 | 33,083 | 2.5% | 97.5% |
| 2011 | 32,739 | 2.3% | 97.7% |
| 2010 | 32,248 | 2.0% | 98.0% |
Nativity & Citizenship FAQs for Louisa County, Virginia
Approximately 4.5% of residents in Louisa County, Virginia were born outside the United States.
The vast majority of residents, roughly 98.5%, are U.S. citizens (including both native-born and naturalized citizens).