Loudoun County, Virginia Nativity & Citizenship Status (2024)
Place of birth and citizenship status analysis for Loudoun County, Virginia
Loudoun County, Virginia Nativity & Citizenship Indicators (2024)
Native Born
72.6%
Foreign Born
27.4%
Naturalized
17.2%
US Citizens
89.8%
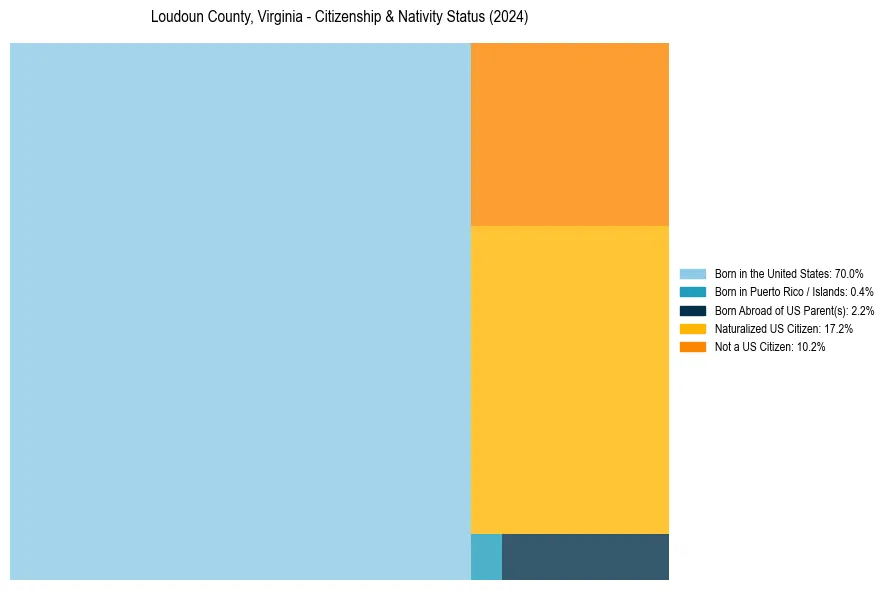
Loudoun County, Virginia Nativity & Citizenship Distribution
Loudoun County, Virginia Historical Nativity Trends (2010–2024)
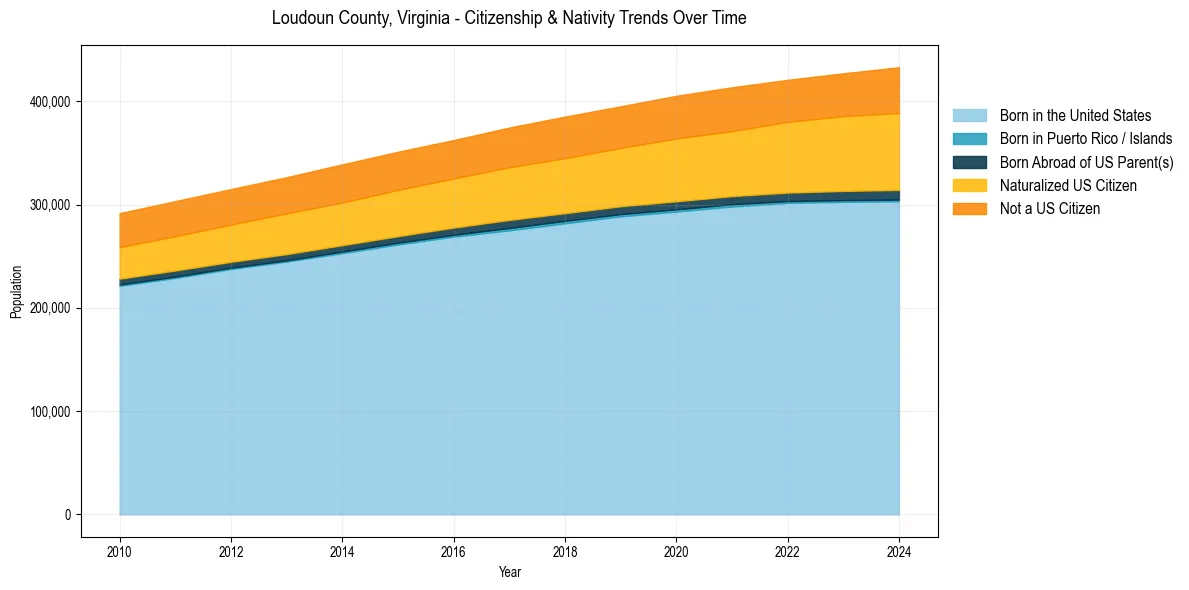
Loudoun County, Virginia Population & Nativity History
| Year | Total Pop | Foreign Born | Native Born |
|---|---|---|---|
| 2024 | 432,998 | 27.4% | 72.6% |
| 2023 | 427,082 | 26.7% | 73.3% |
| 2022 | 420,773 | 25.9% | 74.1% |
| 2021 | 413,574 | 25.5% | 74.5% |
| 2020 | 405,312 | 25.2% | 74.8% |
| 2019 | 395,134 | 24.5% | 75.5% |
| 2018 | 385,143 | 24.3% | 75.7% |
| 2017 | 374,558 | 23.9% | 76.1% |
| 2016 | 362,435 | 23.4% | 76.6% |
| 2015 | 351,129 | 23.3% | 76.7% |
| 2014 | 338,916 | 23.1% | 76.9% |
| 2013 | 326,477 | 22.8% | 77.2% |
| 2012 | 314,980 | 22.4% | 77.6% |
| 2011 | 303,329 | 22.2% | 77.8% |
| 2010 | 291,653 | 21.7% | 78.3% |
Nativity & Citizenship FAQs for Loudoun County, Virginia
Approximately 27.4% of residents in Loudoun County, Virginia were born outside the United States.
The vast majority of residents, roughly 89.8%, are U.S. citizens (including both native-born and naturalized citizens).