King William County, Virginia Nativity & Citizenship Status (2024)
Place of birth and citizenship status analysis for King William County, Virginia
King William County, Virginia Nativity & Citizenship Indicators (2024)
Native Born
97.6%
Foreign Born
2.4%
Naturalized
1.9%
US Citizens
99.5%
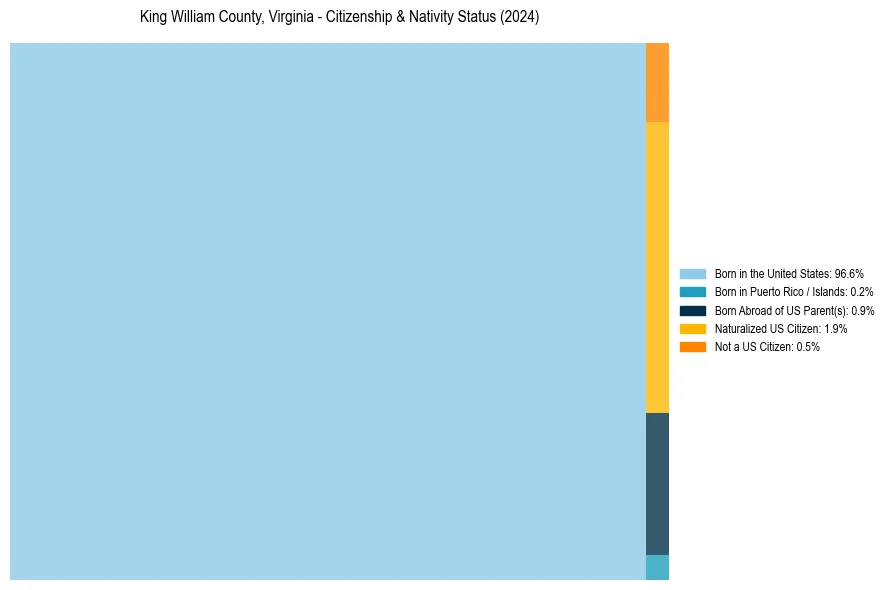
King William County, Virginia Nativity & Citizenship Distribution
King William County, Virginia Historical Nativity Trends (2010–2024)
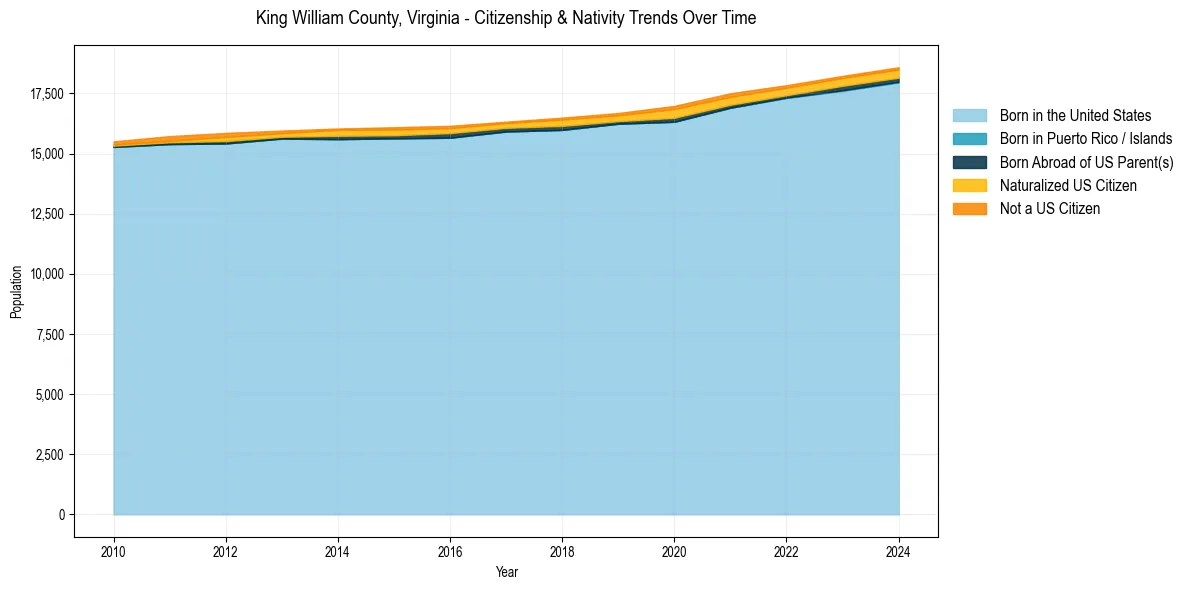
King William County, Virginia Population & Nativity History
| Year | Total Pop | Foreign Born | Native Born |
|---|---|---|---|
| 2024 | 18,593 | 2.4% | 97.6% |
| 2023 | 18,232 | 2.3% | 97.7% |
| 2022 | 17,845 | 2.3% | 97.7% |
| 2021 | 17,511 | 2.7% | 97.3% |
| 2020 | 16,985 | 2.9% | 97.1% |
| 2019 | 16,688 | 2.0% | 98.0% |
| 2018 | 16,497 | 2.1% | 97.9% |
| 2017 | 16,329 | 1.6% | 98.4% |
| 2016 | 16,156 | 1.9% | 98.1% |
| 2015 | 16,097 | 2.1% | 97.9% |
| 2014 | 16,045 | 1.9% | 98.1% |
| 2013 | 15,959 | 1.6% | 98.4% |
| 2012 | 15,861 | 2.1% | 97.9% |
| 2011 | 15,728 | 1.6% | 98.4% |
| 2010 | 15,509 | 1.1% | 98.9% |
Nativity & Citizenship FAQs for King William County, Virginia
Approximately 2.4% of residents in King William County, Virginia were born outside the United States.
The vast majority of residents, roughly 99.5%, are U.S. citizens (including both native-born and naturalized citizens).