King George County, Virginia Nativity & Citizenship Status (2024)
Place of birth and citizenship status analysis for King George County, Virginia
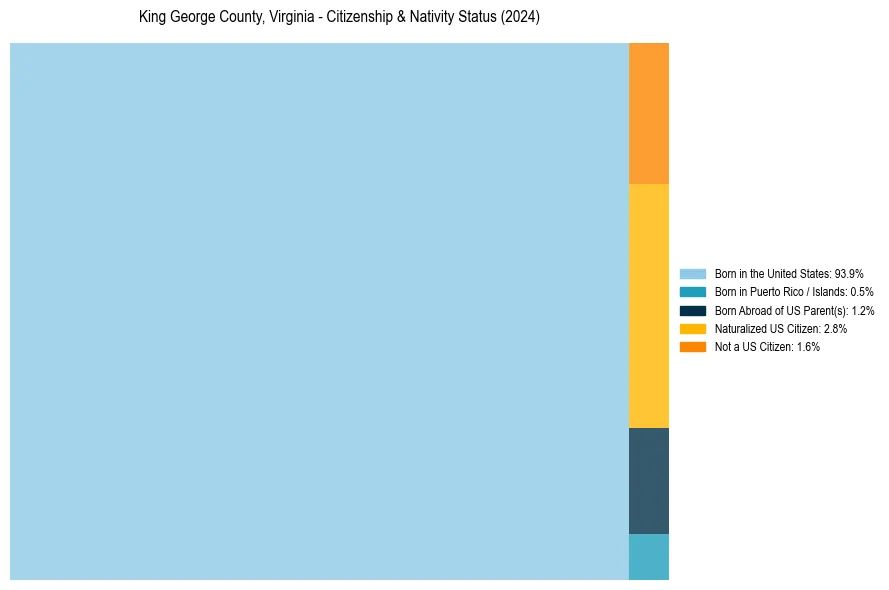
King George County, Virginia Nativity & Citizenship Indicators (2024)
Native Born
95.6%
Foreign Born
4.4%
Naturalized
2.8%
US Citizens
98.4%
King George County, Virginia Nativity & Citizenship Distribution
King George County, Virginia Historical Nativity Trends (2010–2024)
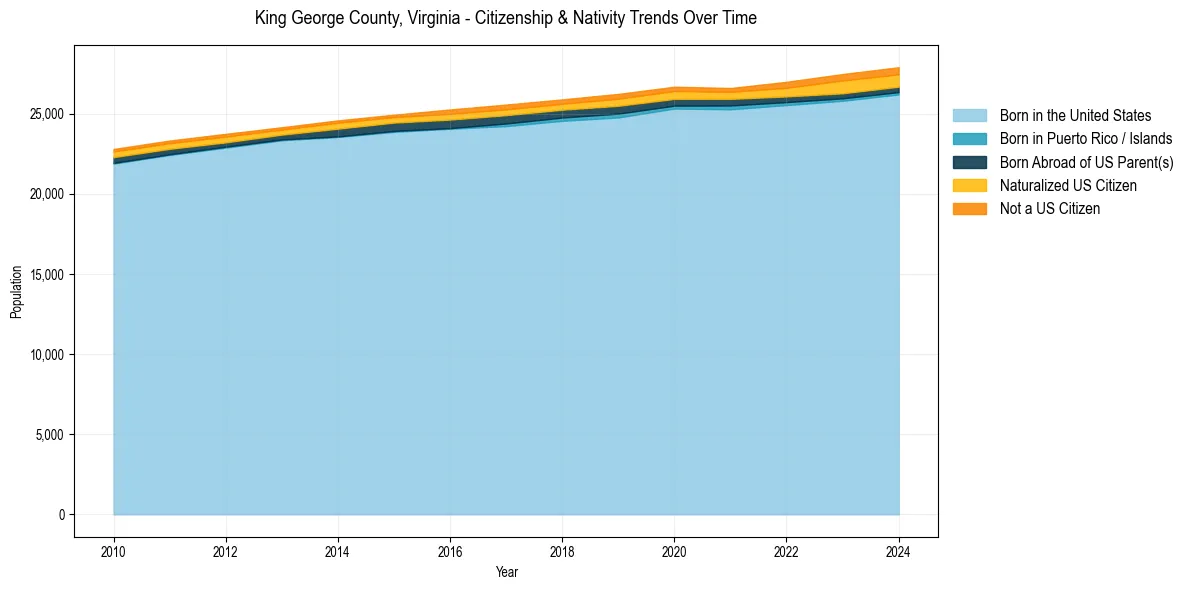
King George County, Virginia Population & Nativity History
| Year | Total Pop | Foreign Born | Native Born |
|---|---|---|---|
| 2024 | 27,896 | 4.4% | 95.6% |
| 2023 | 27,468 | 4.4% | 95.6% |
| 2022 | 26,985 | 3.4% | 96.6% |
| 2021 | 26,597 | 2.6% | 97.4% |
| 2020 | 26,679 | 2.9% | 97.1% |
| 2019 | 26,229 | 2.8% | 97.2% |
| 2018 | 25,890 | 2.5% | 97.5% |
| 2017 | 25,564 | 2.6% | 97.4% |
| 2016 | 25,260 | 2.5% | 97.5% |
| 2015 | 24,933 | 2.0% | 98.0% |
| 2014 | 24,577 | 2.1% | 97.9% |
| 2013 | 24,151 | 1.9% | 98.1% |
| 2012 | 23,739 | 2.2% | 97.8% |
| 2011 | 23,321 | 2.2% | 97.8% |
| 2010 | 22,794 | 2.2% | 97.8% |
Nativity & Citizenship FAQs for King George County, Virginia
Approximately 4.4% of residents in King George County, Virginia were born outside the United States.
The vast majority of residents, roughly 98.4%, are U.S. citizens (including both native-born and naturalized citizens).