Henrico County, Virginia Nativity & Citizenship Status (2024)
Place of birth and citizenship status analysis for Henrico County, Virginia
Henrico County, Virginia Nativity & Citizenship Indicators (2024)
Native Born
86.1%
Foreign Born
13.9%
Naturalized
7.2%
US Citizens
93.3%
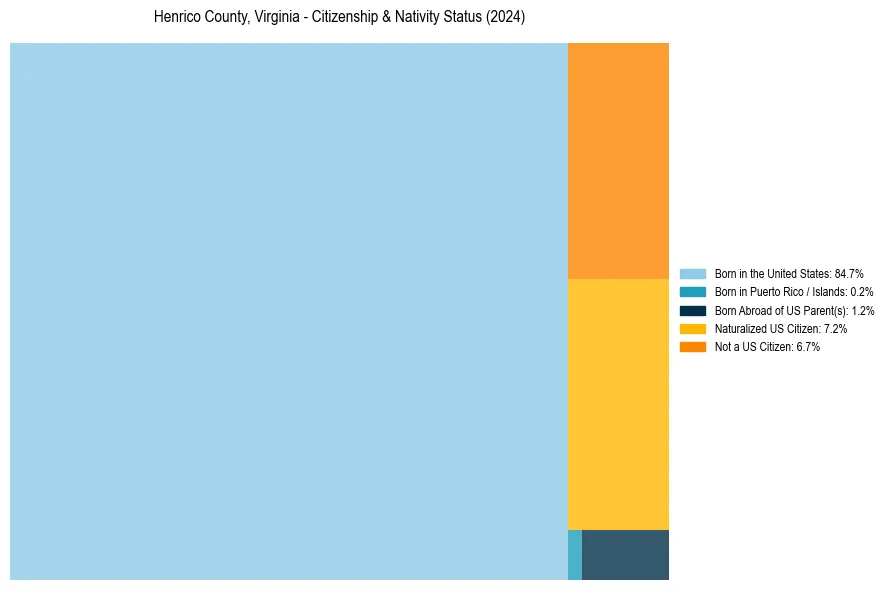
Henrico County, Virginia Nativity & Citizenship Distribution
Henrico County, Virginia Historical Nativity Trends (2010–2024)
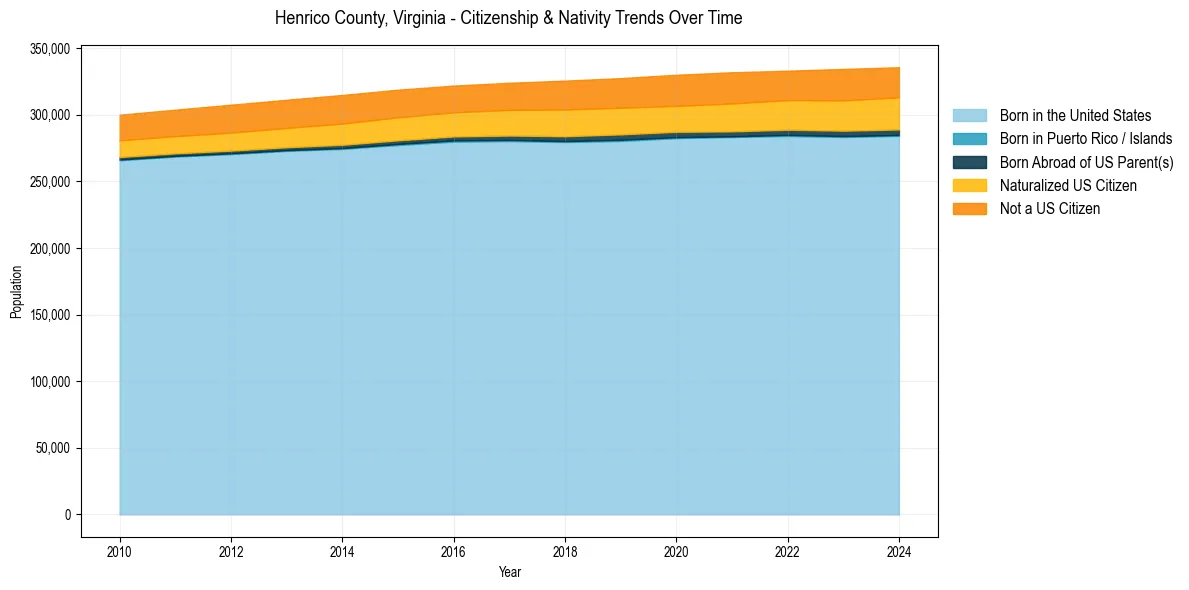
Henrico County, Virginia Population & Nativity History
| Year | Total Pop | Foreign Born | Native Born |
|---|---|---|---|
| 2024 | 335,744 | 13.9% | 86.1% |
| 2023 | 334,434 | 13.9% | 86.1% |
| 2022 | 333,120 | 13.3% | 86.7% |
| 2021 | 331,924 | 13.4% | 86.6% |
| 2020 | 330,076 | 13.0% | 87.0% |
| 2019 | 327,535 | 12.9% | 87.1% |
| 2018 | 325,642 | 12.8% | 87.2% |
| 2017 | 324,073 | 12.2% | 87.8% |
| 2016 | 321,921 | 11.9% | 88.1% |
| 2015 | 318,864 | 11.9% | 88.1% |
| 2014 | 314,878 | 11.9% | 88.1% |
| 2013 | 311,314 | 11.5% | 88.5% |
| 2012 | 307,576 | 11.2% | 88.8% |
| 2011 | 303,845 | 10.8% | 89.2% |
| 2010 | 300,053 | 10.6% | 89.4% |
Nativity & Citizenship FAQs for Henrico County, Virginia
Approximately 13.9% of residents in Henrico County, Virginia were born outside the United States.
The vast majority of residents, roughly 93.3%, are U.S. citizens (including both native-born and naturalized citizens).