Greensville County, Virginia Nativity & Citizenship Status (2024)
Place of birth and citizenship status analysis for Greensville County, Virginia
Greensville County, Virginia Nativity & Citizenship Indicators (2024)
Native Born
95.8%
Foreign Born
4.2%
Naturalized
2.3%
US Citizens
98.2%
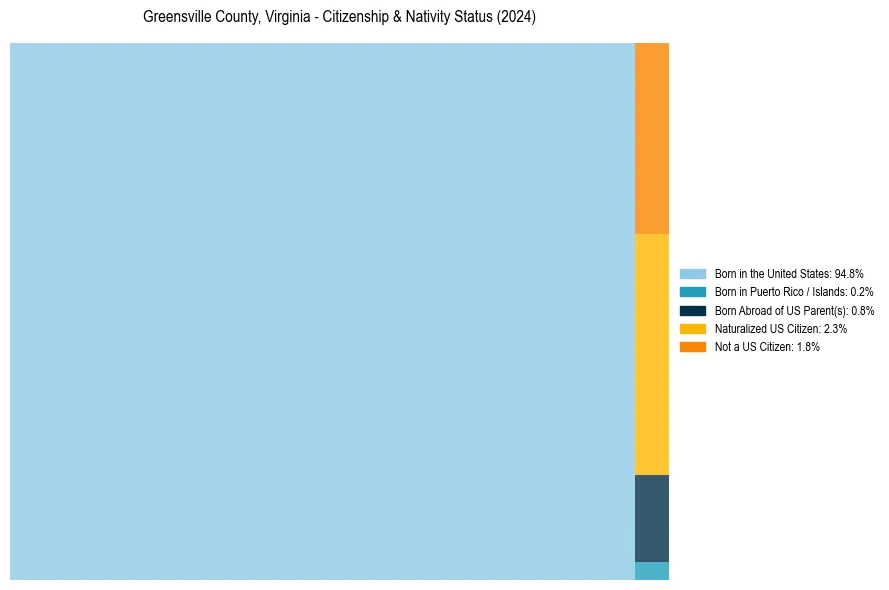
Greensville County, Virginia Nativity & Citizenship Distribution
Greensville County, Virginia Historical Nativity Trends (2010–2024)
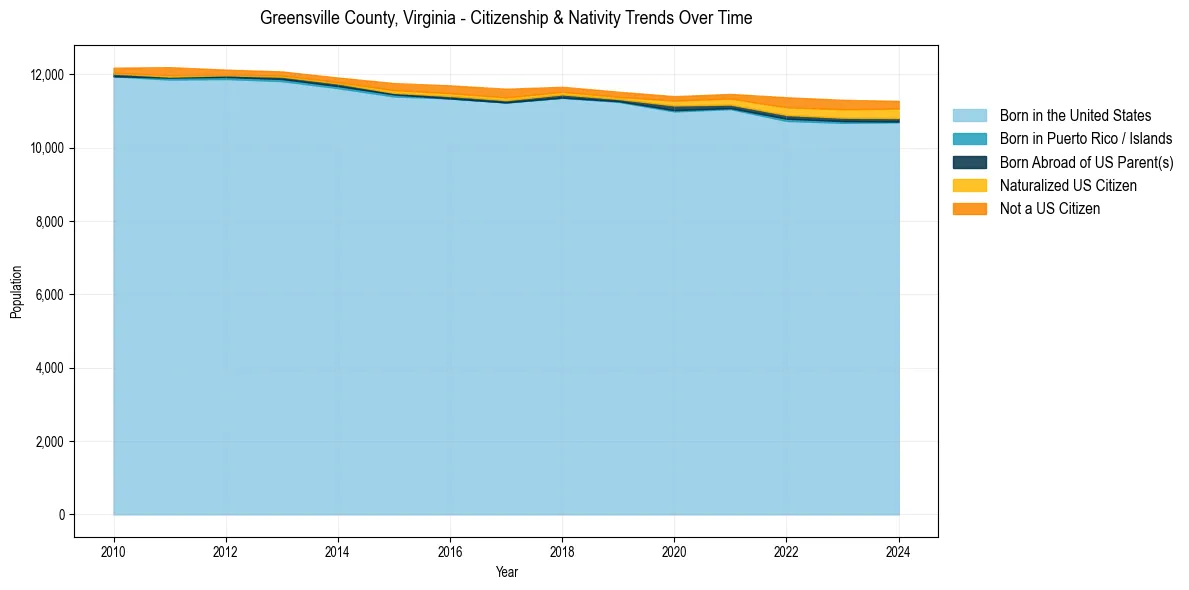
Greensville County, Virginia Population & Nativity History
| Year | Total Pop | Foreign Born | Native Born |
|---|---|---|---|
| 2024 | 11,275 | 4.2% | 95.8% |
| 2023 | 11,304 | 4.3% | 95.7% |
| 2022 | 11,373 | 4.2% | 95.8% |
| 2021 | 11,465 | 2.5% | 97.5% |
| 2020 | 11,403 | 2.2% | 97.8% |
| 2019 | 11,525 | 1.7% | 98.3% |
| 2018 | 11,659 | 1.8% | 98.2% |
| 2017 | 11,606 | 2.7% | 97.3% |
| 2016 | 11,698 | 2.5% | 97.5% |
| 2015 | 11,760 | 2.3% | 97.7% |
| 2014 | 11,911 | 1.4% | 98.6% |
| 2013 | 12,078 | 1.2% | 98.8% |
| 2012 | 12,127 | 1.3% | 98.7% |
| 2011 | 12,194 | 2.1% | 97.9% |
| 2010 | 12,181 | 1.3% | 98.7% |
Nativity & Citizenship FAQs for Greensville County, Virginia
Approximately 4.2% of residents in Greensville County, Virginia were born outside the United States.
The vast majority of residents, roughly 98.2%, are U.S. citizens (including both native-born and naturalized citizens).