Falls Church city, Virginia Nativity & Citizenship Status (2024)
Place of birth and citizenship status analysis for Falls Church city, Virginia
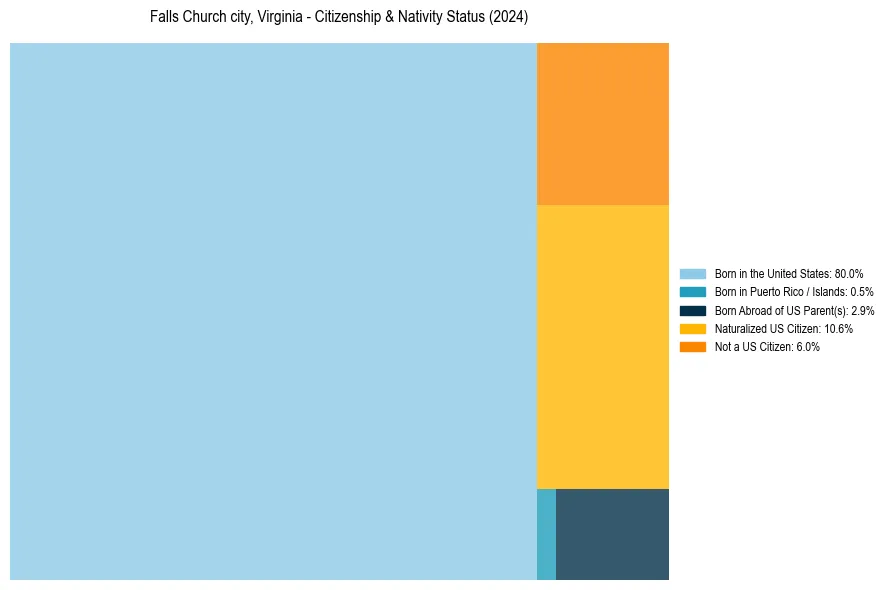
Falls Church city, Virginia Nativity & Citizenship Indicators (2024)
Native Born
83.4%
Foreign Born
16.6%
Naturalized
10.6%
US Citizens
94.0%
Falls Church city, Virginia Nativity & Citizenship Distribution
Falls Church city, Virginia Historical Nativity Trends (2010–2024)
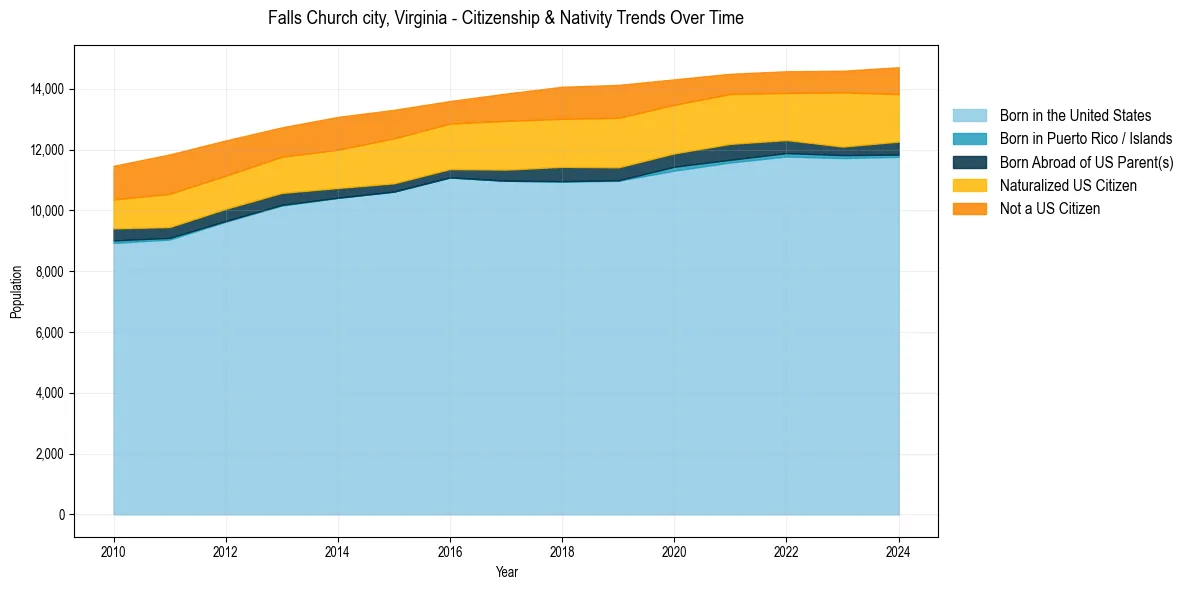
Falls Church city, Virginia Population & Nativity History
| Year | Total Pop | Foreign Born | Native Born |
|---|---|---|---|
| 2024 | 14,710 | 16.6% | 83.4% |
| 2023 | 14,593 | 17.1% | 82.9% |
| 2022 | 14,576 | 15.5% | 84.5% |
| 2021 | 14,494 | 15.9% | 84.1% |
| 2020 | 14,309 | 17.0% | 83.0% |
| 2019 | 14,128 | 19.2% | 80.8% |
| 2018 | 14,067 | 18.7% | 81.3% |
| 2017 | 13,843 | 18.1% | 81.9% |
| 2016 | 13,597 | 16.5% | 83.5% |
| 2015 | 13,308 | 18.2% | 81.8% |
| 2014 | 13,074 | 17.9% | 82.1% |
| 2013 | 12,731 | 16.9% | 83.1% |
| 2012 | 12,300 | 18.3% | 81.7% |
| 2011 | 11,840 | 20.2% | 79.8% |
| 2010 | 11,465 | 17.9% | 82.1% |
Nativity & Citizenship FAQs for Falls Church city, Virginia
Approximately 16.6% of residents in Falls Church city, Virginia were born outside the United States.
The vast majority of residents, roughly 94.0%, are U.S. citizens (including both native-born and naturalized citizens).