Culpeper County, Virginia Nativity & Citizenship Status (2024)
Place of birth and citizenship status analysis for Culpeper County, Virginia
Culpeper County, Virginia Nativity & Citizenship Indicators (2024)
Native Born
90.1%
Foreign Born
9.9%
Naturalized
3.9%
US Citizens
94.0%
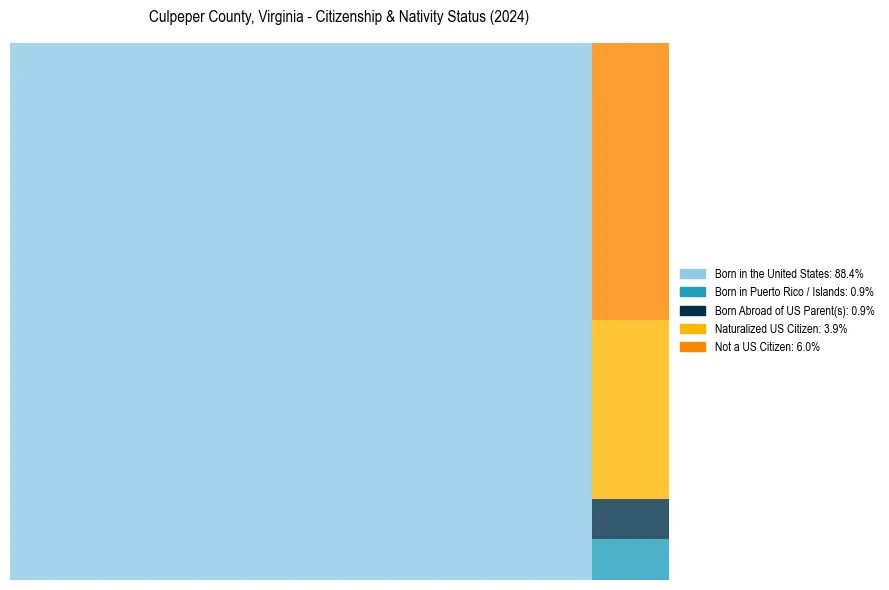
Culpeper County, Virginia Nativity & Citizenship Distribution
Culpeper County, Virginia Historical Nativity Trends (2010–2024)
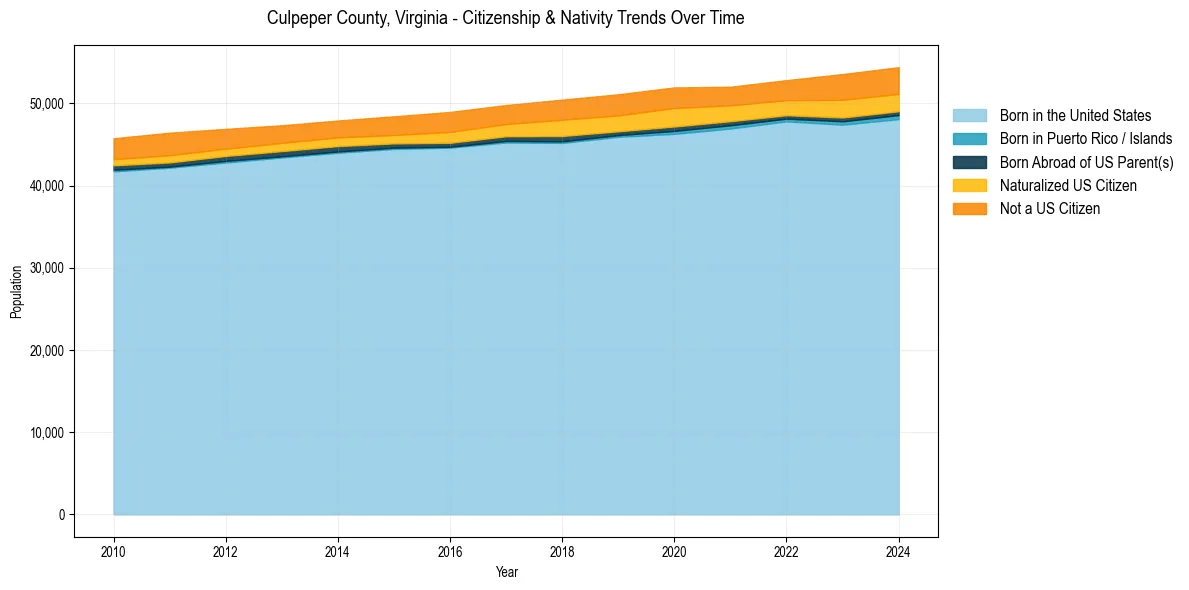
Culpeper County, Virginia Population & Nativity History
| Year | Total Pop | Foreign Born | Native Born |
|---|---|---|---|
| 2024 | 54,397 | 9.9% | 90.1% |
| 2023 | 53,563 | 9.9% | 90.1% |
| 2022 | 52,822 | 8.1% | 91.9% |
| 2021 | 52,021 | 8.1% | 91.9% |
| 2020 | 51,935 | 9.1% | 90.9% |
| 2019 | 51,101 | 8.8% | 91.2% |
| 2018 | 50,450 | 8.8% | 91.2% |
| 2017 | 49,795 | 7.6% | 92.4% |
| 2016 | 48,952 | 7.7% | 92.3% |
| 2015 | 48,424 | 6.8% | 93.2% |
| 2014 | 47,910 | 6.5% | 93.5% |
| 2013 | 47,330 | 6.6% | 93.4% |
| 2012 | 46,894 | 7.0% | 93.0% |
| 2011 | 46,427 | 7.8% | 92.2% |
| 2010 | 45,749 | 7.2% | 92.8% |
Nativity & Citizenship FAQs for Culpeper County, Virginia
Approximately 9.9% of residents in Culpeper County, Virginia were born outside the United States.
The vast majority of residents, roughly 94.0%, are U.S. citizens (including both native-born and naturalized citizens).