Chittenden County, Vermont Nativity & Citizenship Status (2024)
Place of birth and citizenship status analysis for Chittenden County, Vermont
Chittenden County, Vermont Nativity & Citizenship Indicators (2024)
Native Born
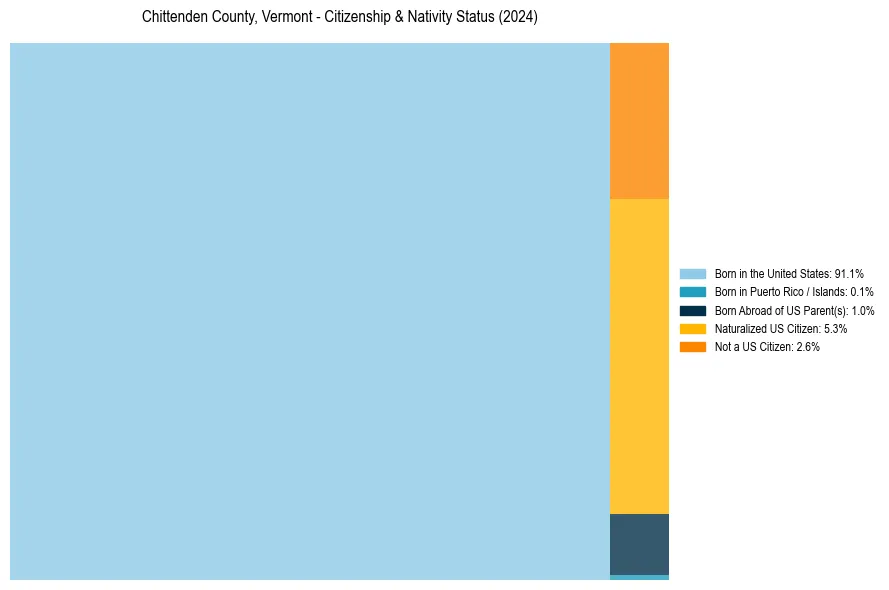
92.1%
Foreign Born
7.9%
Naturalized
5.3%
US Citizens
97.4%
Chittenden County, Vermont Nativity & Citizenship Distribution
Chittenden County, Vermont Historical Nativity Trends (2010–2024)
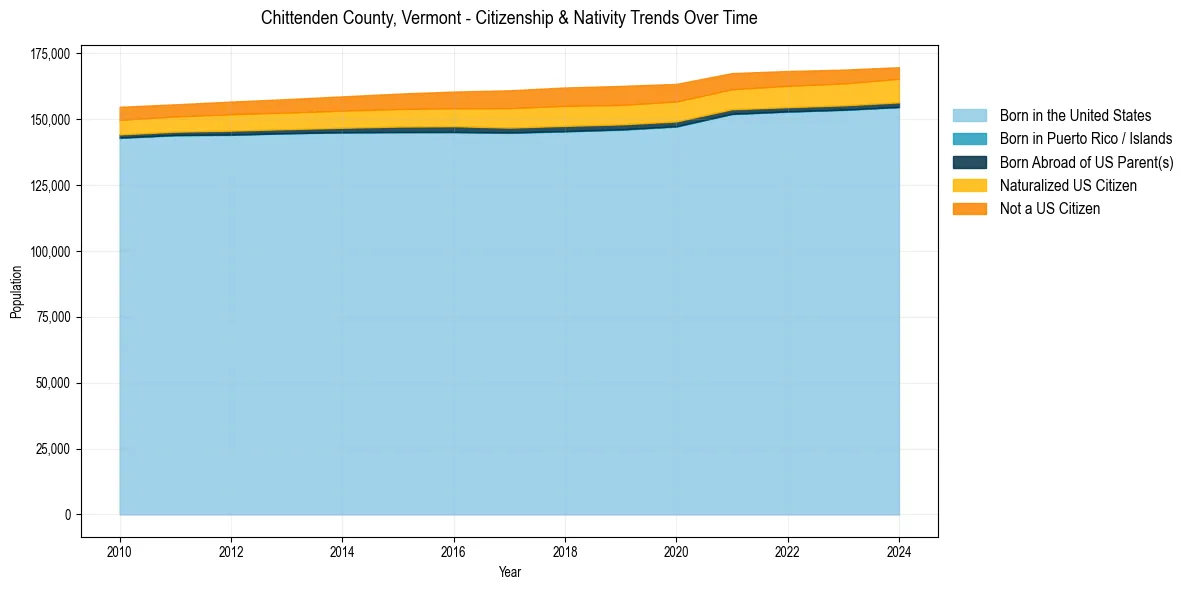
Chittenden County, Vermont Population & Nativity History
| Year | Total Pop | Foreign Born | Native Born |
|---|---|---|---|
| 2024 | 169,758 | 7.9% | 92.1% |
| 2023 | 168,831 | 8.0% | 92.0% |
| 2022 | 168,309 | 8.2% | 91.8% |
| 2021 | 167,523 | 8.2% | 91.8% |
| 2020 | 163,414 | 8.7% | 91.3% |
| 2019 | 162,646 | 9.0% | 91.0% |
| 2018 | 162,052 | 9.0% | 91.0% |
| 2017 | 160,985 | 8.8% | 91.2% |
| 2016 | 160,510 | 8.2% | 91.8% |
| 2015 | 159,711 | 7.8% | 92.2% |
| 2014 | 158,686 | 7.5% | 92.5% |
| 2013 | 157,637 | 7.2% | 92.8% |
| 2012 | 156,696 | 7.0% | 93.0% |
| 2011 | 155,666 | 6.7% | 93.3% |
| 2010 | 154,729 | 6.8% | 93.2% |
Nativity & Citizenship FAQs for Chittenden County, Vermont
Approximately 7.9% of residents in Chittenden County, Vermont were born outside the United States.
The vast majority of residents, roughly 97.4%, are U.S. citizens (including both native-born and naturalized citizens).