Weber County, Utah Nativity & Citizenship Status (2024)
Place of birth and citizenship status analysis for Weber County, Utah
Weber County, Utah Nativity & Citizenship Indicators (2024)
Native Born
93.2%
Foreign Born
6.8%
Naturalized
3.1%
US Citizens
96.3%
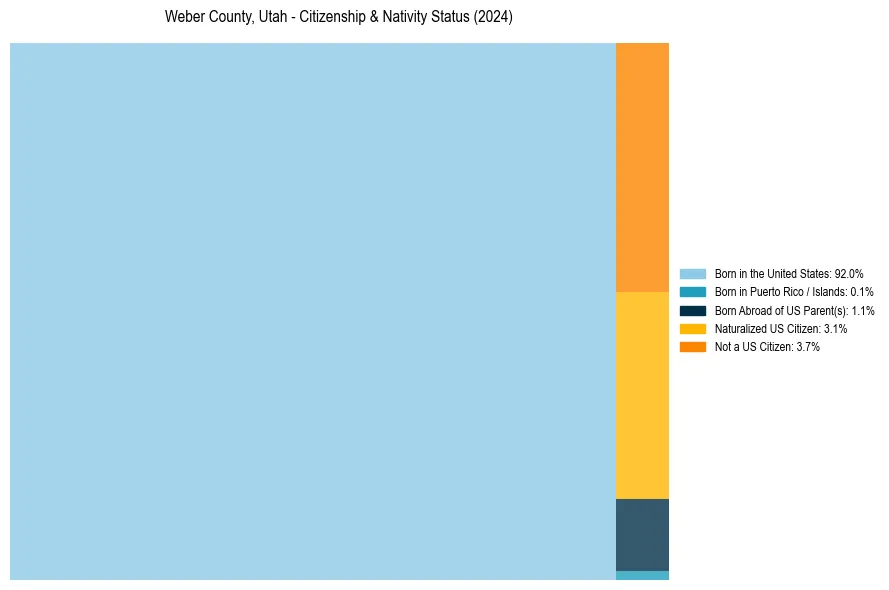
Weber County, Utah Nativity & Citizenship Distribution
Weber County, Utah Historical Nativity Trends (2010–2024)
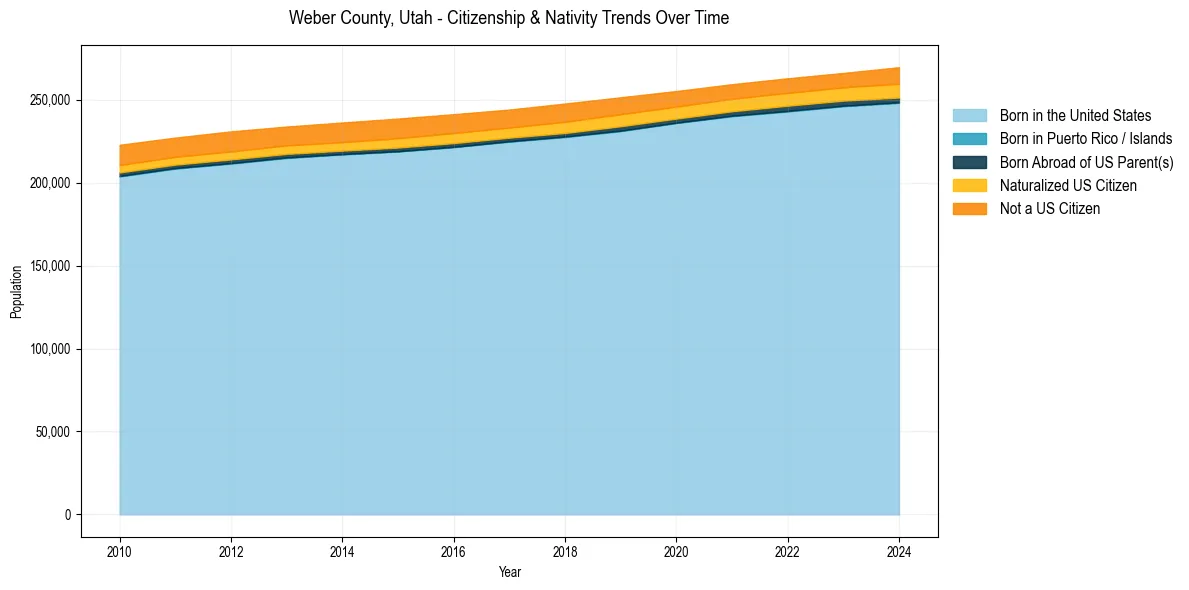
Weber County, Utah Population & Nativity History
| Year | Total Pop | Foreign Born | Native Born |
|---|---|---|---|
| 2024 | 269,648 | 6.8% | 93.2% |
| 2023 | 266,183 | 6.3% | 93.7% |
| 2022 | 262,960 | 6.3% | 93.7% |
| 2021 | 259,390 | 6.3% | 93.7% |
| 2020 | 255,284 | 6.5% | 93.5% |
| 2019 | 251,498 | 6.9% | 93.1% |
| 2018 | 247,731 | 7.2% | 92.8% |
| 2017 | 244,101 | 6.9% | 93.1% |
| 2016 | 241,328 | 7.2% | 92.8% |
| 2015 | 238,682 | 7.3% | 92.7% |
| 2014 | 236,307 | 7.2% | 92.8% |
| 2013 | 233,871 | 7.1% | 92.9% |
| 2012 | 230,940 | 7.3% | 92.7% |
| 2011 | 227,199 | 7.2% | 92.8% |
| 2010 | 222,849 | 7.5% | 92.5% |
Nativity & Citizenship FAQs for Weber County, Utah
Approximately 6.8% of residents in Weber County, Utah were born outside the United States.
The vast majority of residents, roughly 96.3%, are U.S. citizens (including both native-born and naturalized citizens).