Washington County, Utah Nativity & Citizenship Status (2024)
Place of birth and citizenship status analysis for Washington County, Utah
Washington County, Utah Nativity & Citizenship Indicators (2024)
Native Born
94.2%
Foreign Born
5.8%
Naturalized
2.5%
US Citizens
96.7%
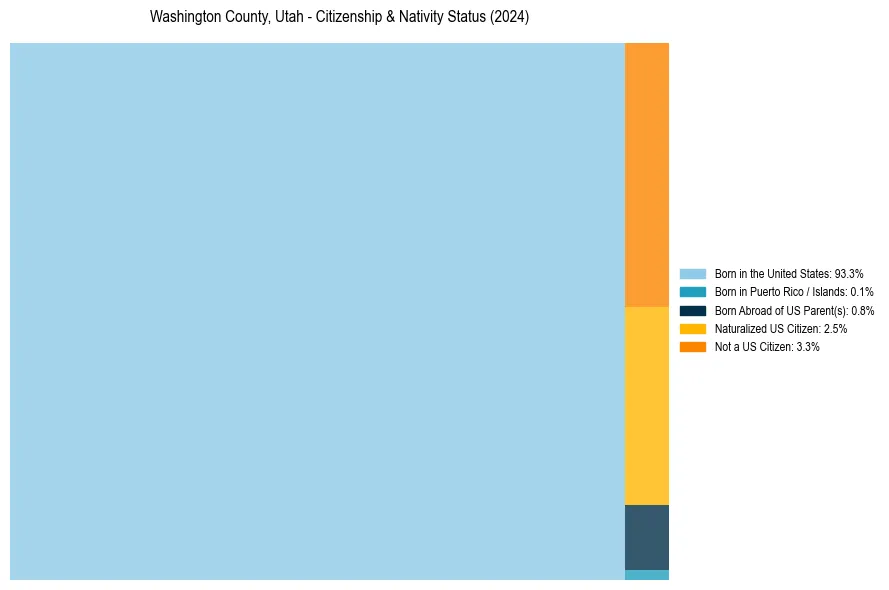
Washington County, Utah Nativity & Citizenship Distribution
Washington County, Utah Historical Nativity Trends (2010–2024)
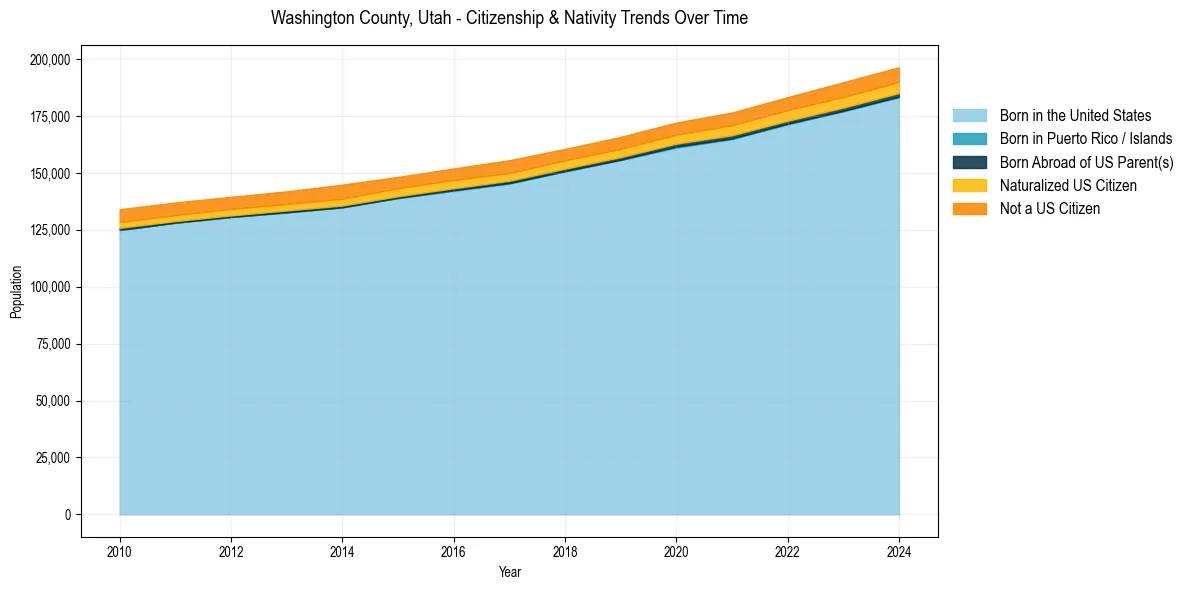
Washington County, Utah Population & Nativity History
| Year | Total Pop | Foreign Born | Native Born |
|---|---|---|---|
| 2024 | 196,431 | 5.8% | 94.2% |
| 2023 | 189,827 | 5.9% | 94.1% |
| 2022 | 183,297 | 5.7% | 94.3% |
| 2021 | 176,533 | 5.7% | 94.3% |
| 2020 | 172,127 | 5.4% | 94.6% |
| 2019 | 165,811 | 5.4% | 94.6% |
| 2018 | 160,537 | 5.4% | 94.6% |
| 2017 | 155,577 | 5.8% | 94.2% |
| 2016 | 151,959 | 5.7% | 94.3% |
| 2015 | 148,244 | 5.7% | 94.3% |
| 2014 | 144,844 | 6.4% | 93.6% |
| 2013 | 141,902 | 5.9% | 94.1% |
| 2012 | 139,484 | 5.9% | 94.1% |
| 2011 | 137,020 | 6.0% | 94.0% |
| 2010 | 134,033 | 6.1% | 93.9% |
Nativity & Citizenship FAQs for Washington County, Utah
Approximately 5.8% of residents in Washington County, Utah were born outside the United States.
The vast majority of residents, roughly 96.7%, are U.S. citizens (including both native-born and naturalized citizens).