Wasatch County, Utah Nativity & Citizenship Status (2024)
Place of birth and citizenship status analysis for Wasatch County, Utah
Wasatch County, Utah Nativity & Citizenship Indicators (2024)
Native Born
91.7%
Foreign Born
8.3%
Naturalized
3.3%
US Citizens
95.0%
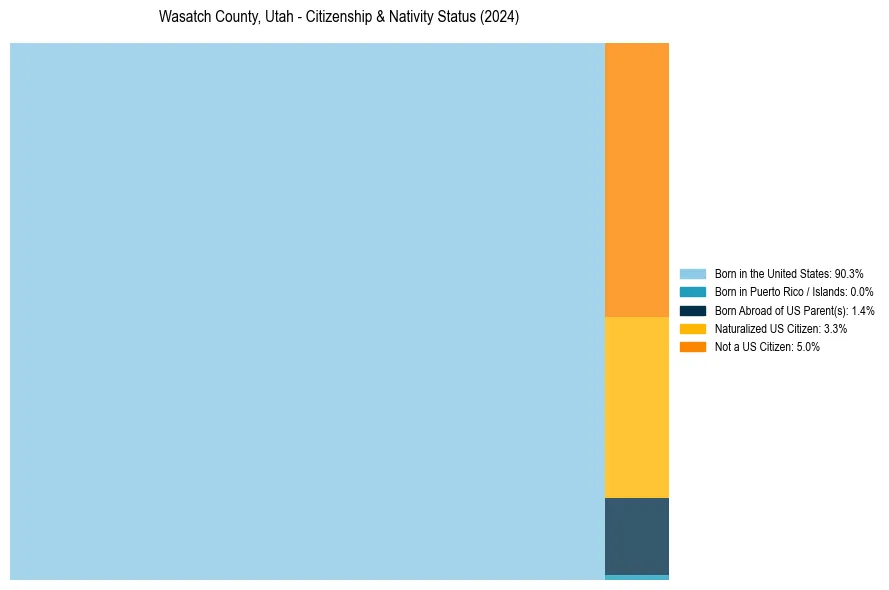
Wasatch County, Utah Nativity & Citizenship Distribution
Wasatch County, Utah Historical Nativity Trends (2010–2024)
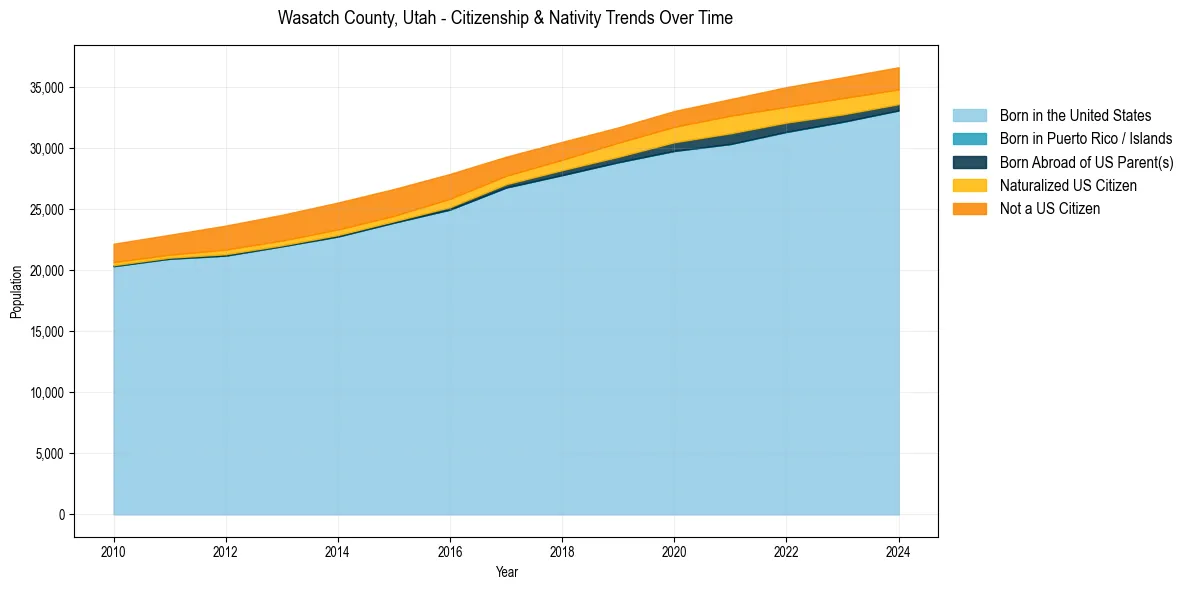
Wasatch County, Utah Population & Nativity History
| Year | Total Pop | Foreign Born | Native Born |
|---|---|---|---|
| 2024 | 36,642 | 8.3% | 91.7% |
| 2023 | 35,808 | 8.5% | 91.5% |
| 2022 | 35,009 | 8.3% | 91.7% |
| 2021 | 34,028 | 8.2% | 91.8% |
| 2020 | 33,053 | 7.7% | 92.3% |
| 2019 | 31,708 | 7.6% | 92.4% |
| 2018 | 30,523 | 7.6% | 92.4% |
| 2017 | 29,306 | 7.7% | 92.3% |
| 2016 | 27,895 | 9.8% | 90.2% |
| 2015 | 26,661 | 9.9% | 90.1% |
| 2014 | 25,550 | 10.4% | 89.6% |
| 2013 | 24,542 | 10.2% | 89.8% |
| 2012 | 23,661 | 9.9% | 90.1% |
| 2011 | 22,908 | 8.2% | 91.8% |
| 2010 | 22,176 | 7.9% | 92.1% |
Nativity & Citizenship FAQs for Wasatch County, Utah
Approximately 8.3% of residents in Wasatch County, Utah were born outside the United States.
The vast majority of residents, roughly 95.0%, are U.S. citizens (including both native-born and naturalized citizens).