Utah County, Utah Nativity & Citizenship Status (2024)
Place of birth and citizenship status analysis for Utah County, Utah
Utah County, Utah Nativity & Citizenship Indicators (2024)
Native Born
91.8%
Foreign Born
8.2%
Naturalized
3.2%
US Citizens
94.9%
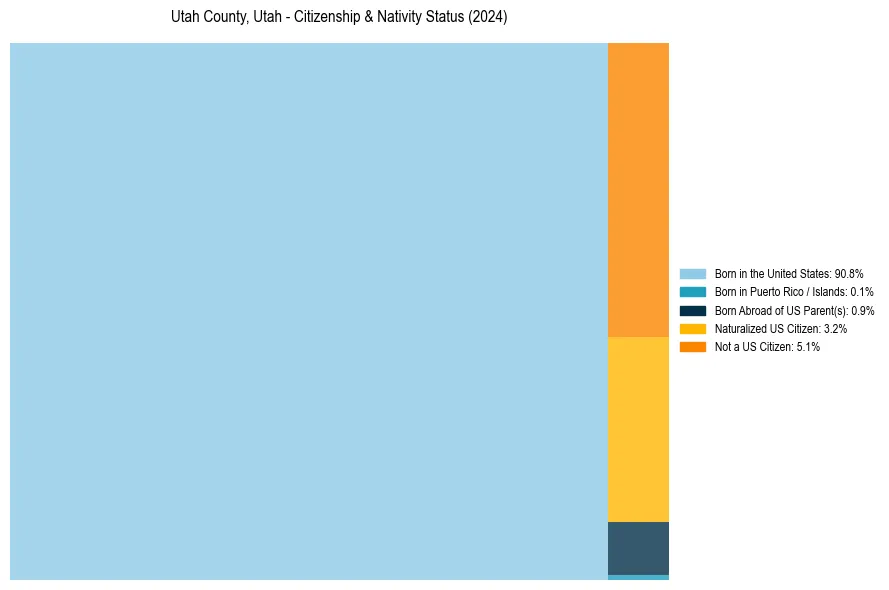
Utah County, Utah Nativity & Citizenship Distribution
Utah County, Utah Historical Nativity Trends (2010–2024)
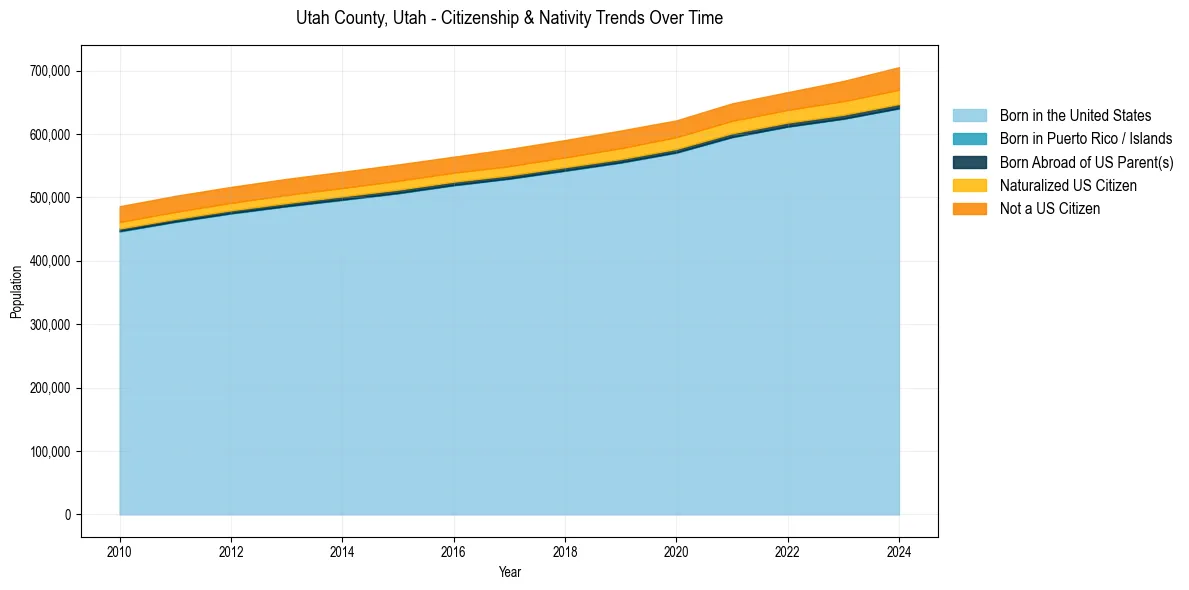
Utah County, Utah Population & Nativity History
| Year | Total Pop | Foreign Born | Native Born |
|---|---|---|---|
| 2024 | 705,400 | 8.2% | 91.8% |
| 2023 | 683,622 | 7.8% | 92.2% |
| 2022 | 666,021 | 7.2% | 92.8% |
| 2021 | 648,265 | 7.3% | 92.7% |
| 2020 | 621,506 | 7.3% | 92.7% |
| 2019 | 605,490 | 7.4% | 92.6% |
| 2018 | 590,440 | 7.2% | 92.8% |
| 2017 | 576,496 | 7.2% | 92.8% |
| 2016 | 564,177 | 7.0% | 93.0% |
| 2015 | 551,957 | 7.2% | 92.8% |
| 2014 | 540,425 | 7.2% | 92.8% |
| 2013 | 529,262 | 7.2% | 92.8% |
| 2012 | 516,571 | 7.2% | 92.8% |
| 2011 | 502,465 | 7.3% | 92.7% |
| 2010 | 486,067 | 7.2% | 92.8% |
Nativity & Citizenship FAQs for Utah County, Utah
Approximately 8.2% of residents in Utah County, Utah were born outside the United States.
The vast majority of residents, roughly 94.9%, are U.S. citizens (including both native-born and naturalized citizens).