Summit County, Utah Nativity & Citizenship Status (2024)
Place of birth and citizenship status analysis for Summit County, Utah
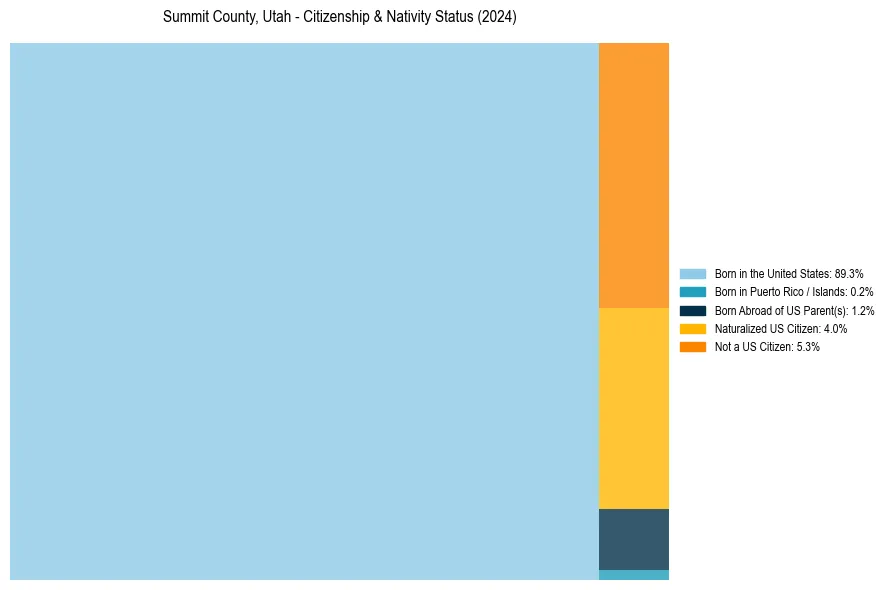
Summit County, Utah Nativity & Citizenship Indicators (2024)
Native Born
90.7%
Foreign Born
9.3%
Naturalized
4.0%
US Citizens
94.7%
Summit County, Utah Nativity & Citizenship Distribution
Summit County, Utah Historical Nativity Trends (2010–2024)
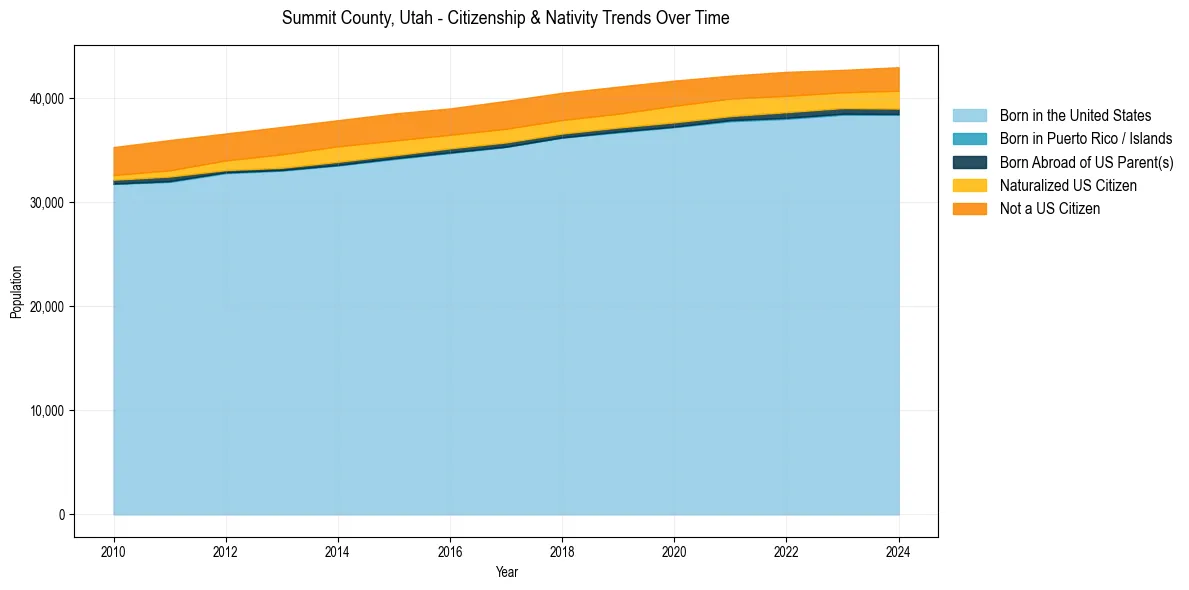
Summit County, Utah Population & Nativity History
| Year | Total Pop | Foreign Born | Native Born |
|---|---|---|---|
| 2024 | 42,970 | 9.3% | 90.7% |
| 2023 | 42,709 | 8.6% | 91.4% |
| 2022 | 42,524 | 9.1% | 90.9% |
| 2021 | 42,156 | 9.2% | 90.8% |
| 2020 | 41,680 | 9.6% | 90.4% |
| 2019 | 41,103 | 9.6% | 90.4% |
| 2018 | 40,511 | 9.7% | 90.3% |
| 2017 | 39,731 | 10.0% | 90.0% |
| 2016 | 39,009 | 9.8% | 90.2% |
| 2015 | 38,521 | 10.4% | 89.6% |
| 2014 | 37,877 | 10.6% | 89.4% |
| 2013 | 37,232 | 10.6% | 89.4% |
| 2012 | 36,598 | 9.6% | 90.4% |
| 2011 | 35,968 | 9.8% | 90.2% |
| 2010 | 35,295 | 8.9% | 91.1% |
Nativity & Citizenship FAQs for Summit County, Utah
Approximately 9.3% of residents in Summit County, Utah were born outside the United States.
The vast majority of residents, roughly 94.7%, are U.S. citizens (including both native-born and naturalized citizens).