Sanpete County, Utah Nativity & Citizenship Status (2024)
Place of birth and citizenship status analysis for Sanpete County, Utah
Sanpete County, Utah Nativity & Citizenship Indicators (2024)
Native Born
94.4%
Foreign Born
5.6%
Naturalized
1.9%
US Citizens
96.2%
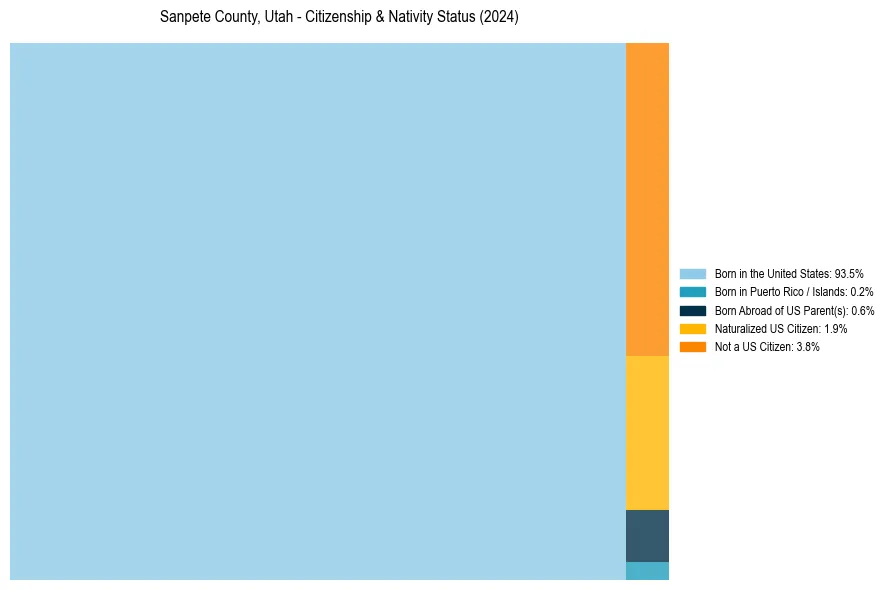
Sanpete County, Utah Nativity & Citizenship Distribution
Sanpete County, Utah Historical Nativity Trends (2010–2024)
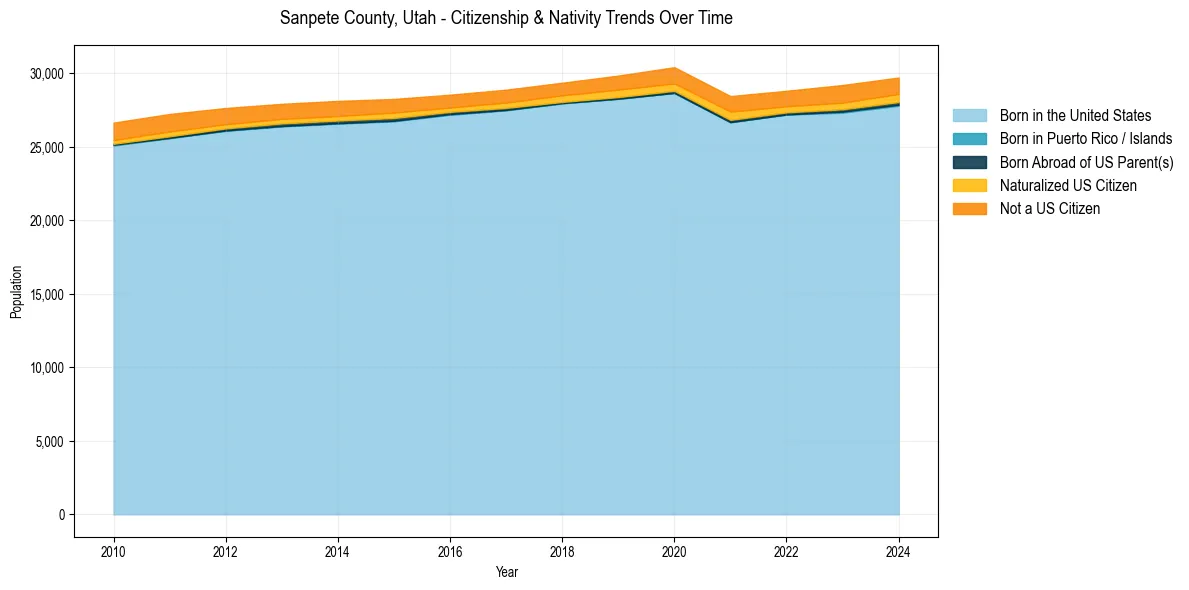
Sanpete County, Utah Population & Nativity History
| Year | Total Pop | Foreign Born | Native Born |
|---|---|---|---|
| 2024 | 29,719 | 5.6% | 94.4% |
| 2023 | 29,209 | 5.7% | 94.3% |
| 2022 | 28,816 | 5.1% | 94.9% |
| 2021 | 28,458 | 5.7% | 94.3% |
| 2020 | 30,421 | 5.3% | 94.7% |
| 2019 | 29,850 | 4.9% | 95.1% |
| 2018 | 29,366 | 4.5% | 95.5% |
| 2017 | 28,892 | 4.3% | 95.7% |
| 2016 | 28,551 | 4.1% | 95.9% |
| 2015 | 28,261 | 4.6% | 95.4% |
| 2014 | 28,129 | 4.7% | 95.3% |
| 2013 | 27,930 | 4.8% | 95.2% |
| 2012 | 27,645 | 5.0% | 95.0% |
| 2011 | 27,239 | 5.6% | 94.4% |
| 2010 | 26,651 | 5.4% | 94.6% |
Nativity & Citizenship FAQs for Sanpete County, Utah
Approximately 5.6% of residents in Sanpete County, Utah were born outside the United States.
The vast majority of residents, roughly 96.2%, are U.S. citizens (including both native-born and naturalized citizens).