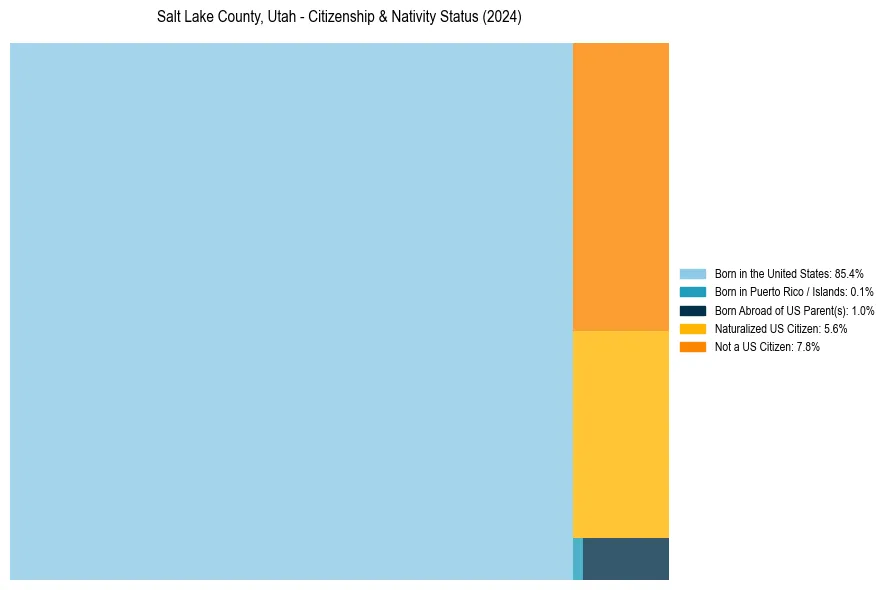
Salt Lake County, Utah Nativity & Citizenship Status (2024)
Place of birth and citizenship status analysis for Salt Lake County, Utah
Salt Lake County, Utah Nativity & Citizenship Indicators (2024)
Native Born
86.5%
Foreign Born
13.5%
Naturalized
5.6%
US Citizens
92.2%
Salt Lake County, Utah Nativity & Citizenship Distribution
Salt Lake County, Utah Historical Nativity Trends (2010–2024)
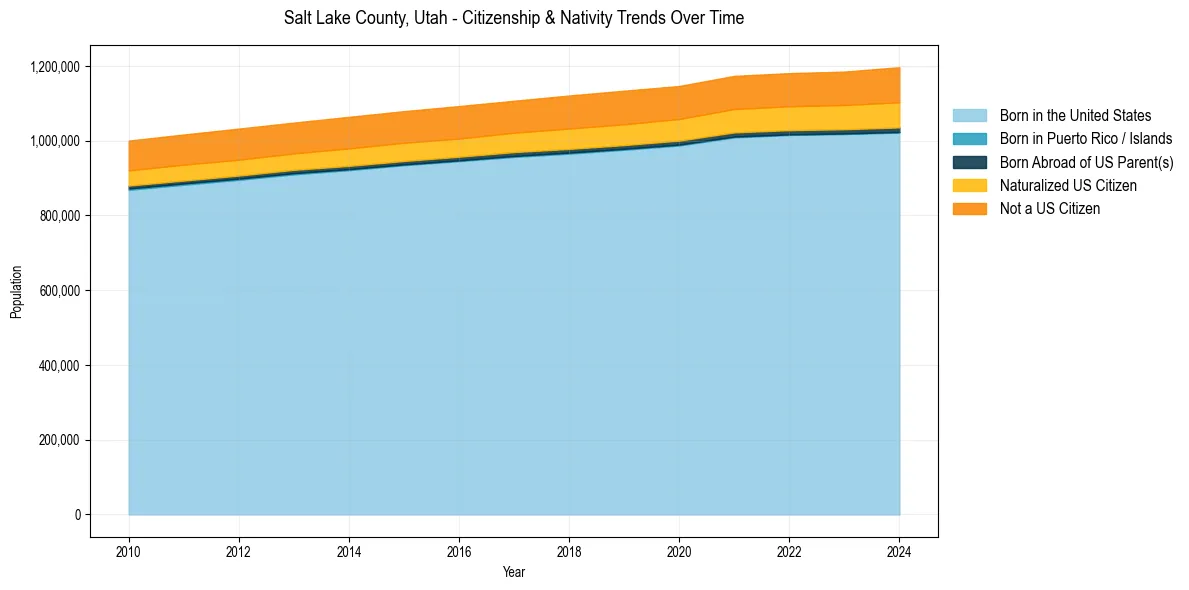
Salt Lake County, Utah Population & Nativity History
| Year | Total Pop | Foreign Born | Native Born |
|---|---|---|---|
| 2024 | 1,196,523 | 13.5% | 86.5% |
| 2023 | 1,184,689 | 13.0% | 87.0% |
| 2022 | 1,180,643 | 12.9% | 87.1% |
| 2021 | 1,173,331 | 12.9% | 87.1% |
| 2020 | 1,146,215 | 12.8% | 87.2% |
| 2019 | 1,133,646 | 12.8% | 87.2% |
| 2018 | 1,120,805 | 12.8% | 87.2% |
| 2017 | 1,106,700 | 12.4% | 87.6% |
| 2016 | 1,092,518 | 12.4% | 87.6% |
| 2015 | 1,078,958 | 12.4% | 87.6% |
| 2014 | 1,063,670 | 12.3% | 87.7% |
| 2013 | 1,048,314 | 12.1% | 87.9% |
| 2012 | 1,032,226 | 12.2% | 87.8% |
| 2011 | 1,016,455 | 12.1% | 87.9% |
| 2010 | 1,000,155 | 12.0% | 88.0% |
Nativity & Citizenship FAQs for Salt Lake County, Utah
Approximately 13.5% of residents in Salt Lake County, Utah were born outside the United States.
The vast majority of residents, roughly 92.2%, are U.S. citizens (including both native-born and naturalized citizens).