Utah Nativity & Citizenship Status (2024)
Place of birth and citizenship status analysis for Utah
Utah Nativity & Citizenship Indicators (2024)
Native Born
91.1%
Foreign Born
8.9%
Naturalized
3.8%
US Citizens
94.9%
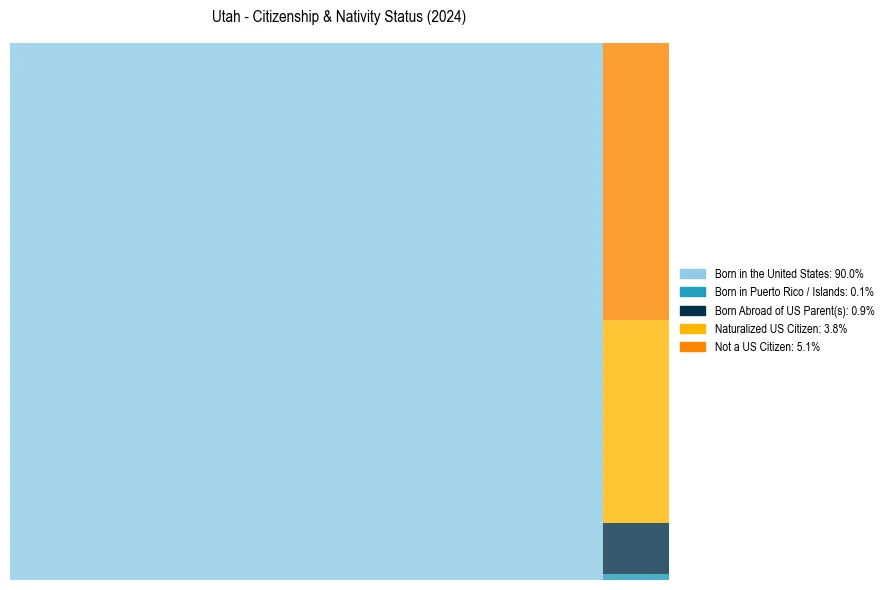
Utah Nativity & Citizenship Distribution
Utah Historical Nativity Trends (2010–2024)
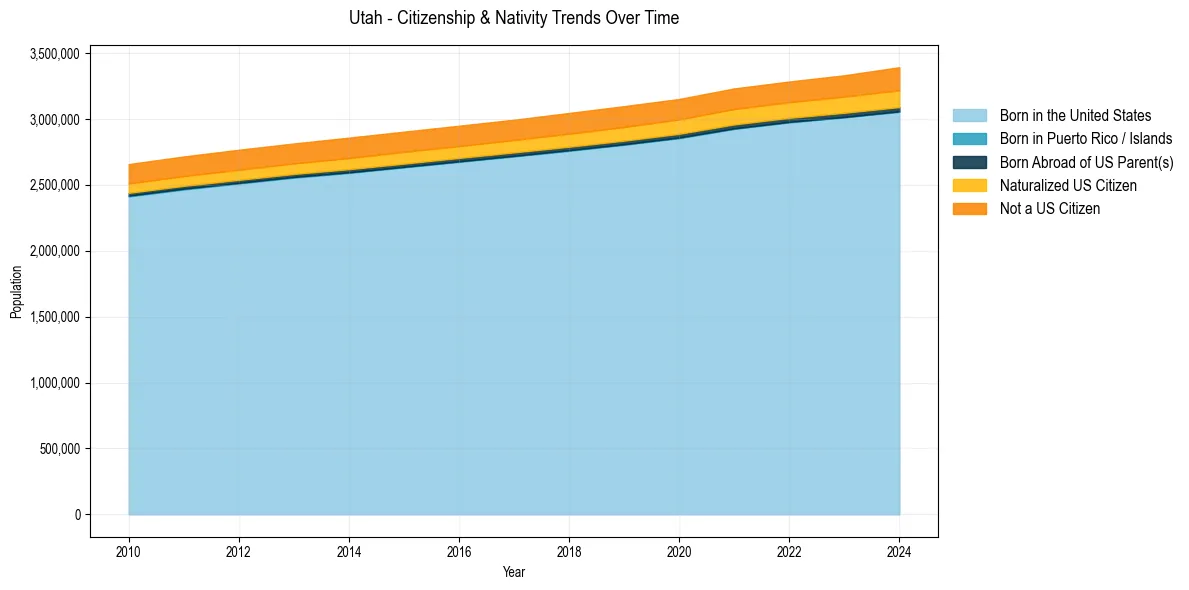
Utah Population & Nativity History
| Year | Total Pop | Foreign Born | Native Born |
|---|---|---|---|
| 2024 | 3,392,331 | 8.9% | 91.1% |
| 2023 | 3,331,187 | 8.6% | 91.4% |
| 2022 | 3,283,809 | 8.4% | 91.6% |
| 2021 | 3,231,370 | 8.5% | 91.5% |
| 2020 | 3,151,239 | 8.4% | 91.6% |
| 2019 | 3,096,848 | 8.5% | 91.5% |
| 2018 | 3,045,350 | 8.4% | 91.6% |
| 2017 | 2,993,941 | 8.3% | 91.7% |
| 2016 | 2,948,427 | 8.3% | 91.7% |
| 2015 | 2,903,379 | 8.4% | 91.6% |
| 2014 | 2,858,111 | 8.4% | 91.6% |
| 2013 | 2,813,673 | 8.2% | 91.8% |
| 2012 | 2,766,233 | 8.3% | 91.7% |
| 2011 | 2,715,379 | 8.2% | 91.8% |
| 2010 | 2,657,236 | 8.2% | 91.8% |
Nativity & Citizenship FAQs for Utah
Approximately 8.9% of residents in Utah were born outside the United States.
The vast majority of residents, roughly 94.9%, are U.S. citizens (including both native-born and naturalized citizens).