Iron County, Utah Nativity & Citizenship Status (2024)
Place of birth and citizenship status analysis for Iron County, Utah
Iron County, Utah Nativity & Citizenship Indicators (2024)
Native Born
95.7%
Foreign Born
4.3%
Naturalized
2.1%
US Citizens
97.8%
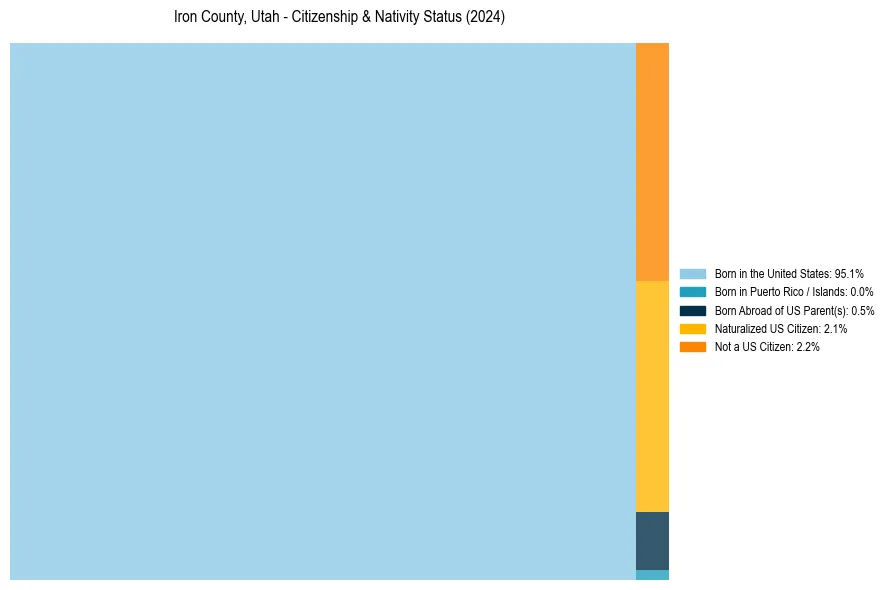
Iron County, Utah Nativity & Citizenship Distribution
Iron County, Utah Historical Nativity Trends (2010–2024)
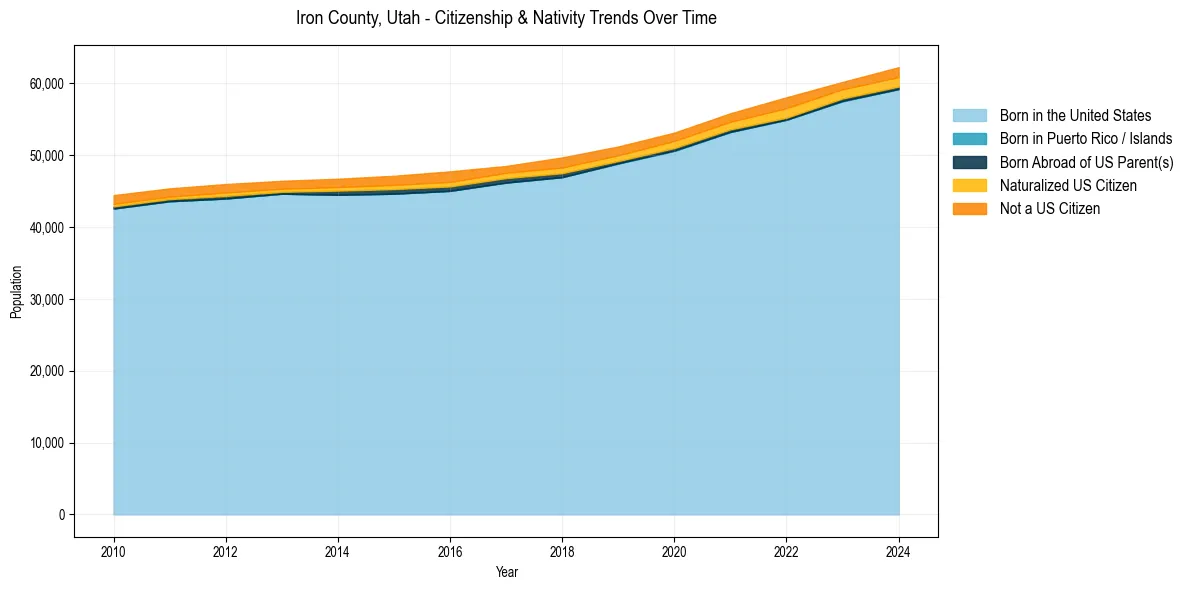
Iron County, Utah Population & Nativity History
| Year | Total Pop | Foreign Born | Native Born |
|---|---|---|---|
| 2024 | 62,252 | 4.3% | 95.7% |
| 2023 | 60,201 | 3.8% | 96.2% |
| 2022 | 58,068 | 4.9% | 95.1% |
| 2021 | 55,839 | 4.0% | 96.0% |
| 2020 | 53,148 | 4.0% | 96.0% |
| 2019 | 51,213 | 4.0% | 96.0% |
| 2018 | 49,691 | 4.4% | 95.6% |
| 2017 | 48,504 | 3.5% | 96.5% |
| 2016 | 47,751 | 4.4% | 95.6% |
| 2015 | 47,139 | 3.9% | 96.1% |
| 2014 | 46,725 | 3.5% | 96.5% |
| 2013 | 46,435 | 3.3% | 96.7% |
| 2012 | 45,984 | 3.6% | 96.4% |
| 2011 | 45,383 | 3.3% | 96.7% |
| 2010 | 44,439 | 3.5% | 96.5% |
Nativity & Citizenship FAQs for Iron County, Utah
Approximately 4.3% of residents in Iron County, Utah were born outside the United States.
The vast majority of residents, roughly 97.8%, are U.S. citizens (including both native-born and naturalized citizens).