Davis County, Utah Nativity & Citizenship Status (2024)
Place of birth and citizenship status analysis for Davis County, Utah
Davis County, Utah Nativity & Citizenship Indicators (2024)
Native Born
94.2%
Foreign Born
5.8%
Naturalized
3.0%
US Citizens
97.2%
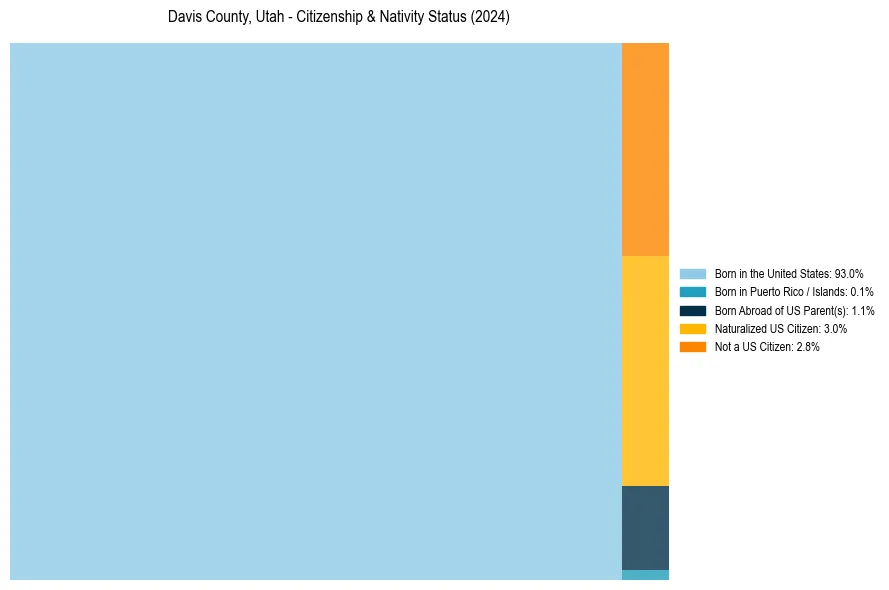
Davis County, Utah Nativity & Citizenship Distribution
Davis County, Utah Historical Nativity Trends (2010–2024)
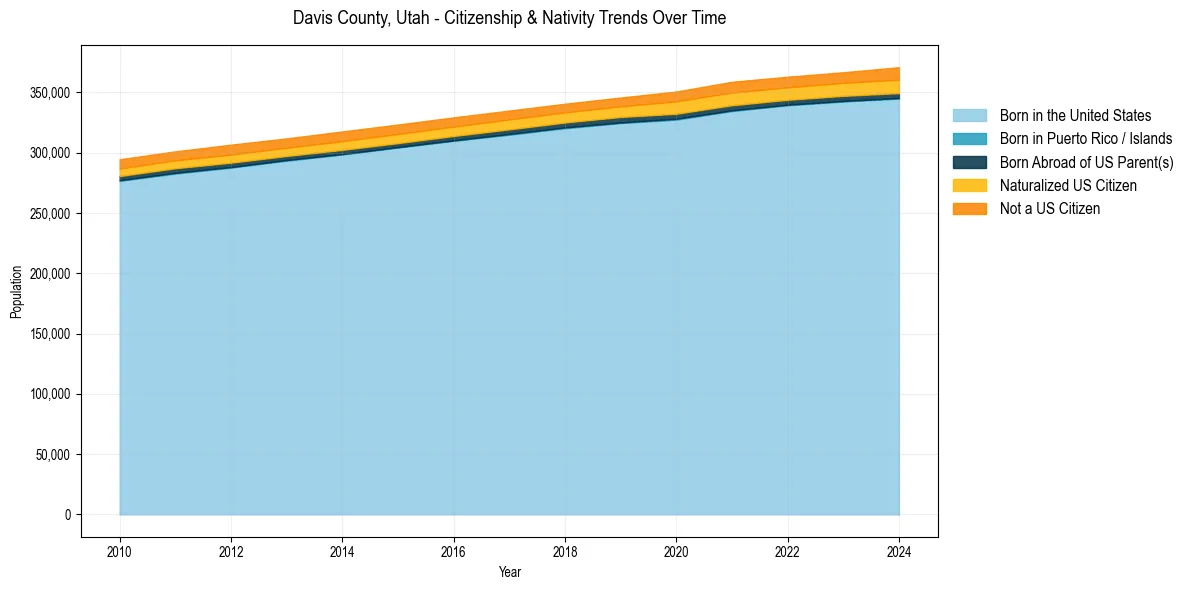
Davis County, Utah Population & Nativity History
| Year | Total Pop | Foreign Born | Native Born |
|---|---|---|---|
| 2024 | 370,924 | 5.8% | 94.2% |
| 2023 | 366,742 | 5.3% | 94.7% |
| 2022 | 363,032 | 5.3% | 94.7% |
| 2021 | 358,831 | 5.4% | 94.6% |
| 2020 | 350,761 | 5.3% | 94.7% |
| 2019 | 345,767 | 4.7% | 95.3% |
| 2018 | 340,621 | 4.6% | 95.4% |
| 2017 | 334,977 | 4.7% | 95.3% |
| 2016 | 329,292 | 4.7% | 95.3% |
| 2015 | 323,374 | 4.8% | 95.2% |
| 2014 | 317,646 | 4.8% | 95.2% |
| 2013 | 311,886 | 4.7% | 95.3% |
| 2012 | 306,664 | 4.9% | 95.1% |
| 2011 | 301,124 | 4.7% | 95.3% |
| 2010 | 294,532 | 4.7% | 95.3% |
Nativity & Citizenship FAQs for Davis County, Utah
Approximately 5.8% of residents in Davis County, Utah were born outside the United States.
The vast majority of residents, roughly 97.2%, are U.S. citizens (including both native-born and naturalized citizens).