Wichita County, Texas Nativity & Citizenship Status (2024)
Place of birth and citizenship status analysis for Wichita County, Texas
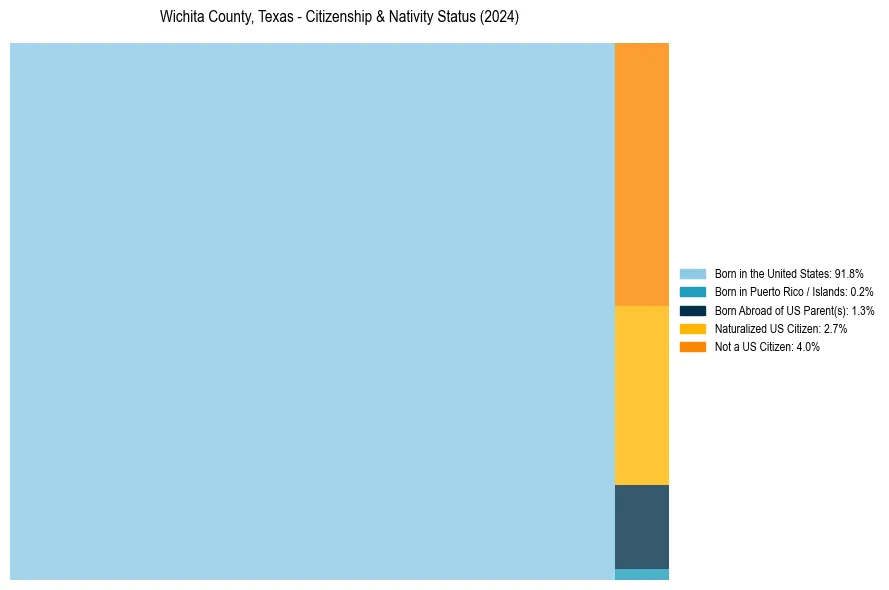
Wichita County, Texas Nativity & Citizenship Indicators (2024)
Native Born
93.3%
Foreign Born
6.7%
Naturalized
2.7%
US Citizens
96.0%
Wichita County, Texas Nativity & Citizenship Distribution
Wichita County, Texas Historical Nativity Trends (2010–2024)
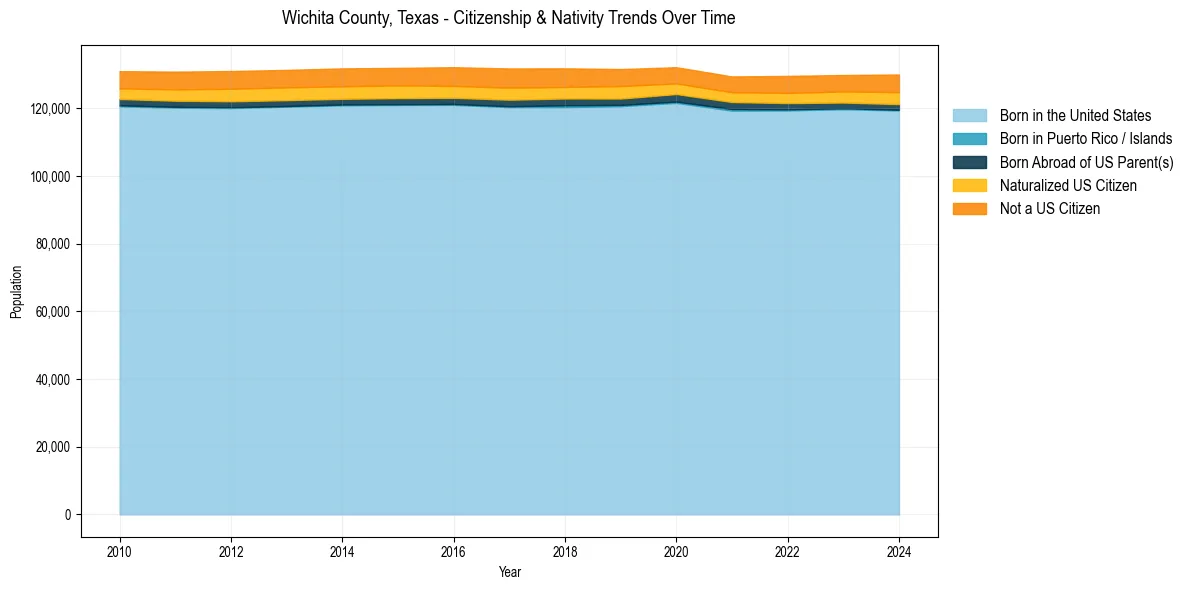
Wichita County, Texas Population & Nativity History
| Year | Total Pop | Foreign Born | Native Born |
|---|---|---|---|
| 2024 | 129,996 | 6.7% | 93.3% |
| 2023 | 129,842 | 6.3% | 93.7% |
| 2022 | 129,584 | 6.2% | 93.8% |
| 2021 | 129,419 | 5.8% | 94.2% |
| 2020 | 132,154 | 6.0% | 94.0% |
| 2019 | 131,596 | 6.6% | 93.4% |
| 2018 | 131,818 | 6.8% | 93.2% |
| 2017 | 131,778 | 7.0% | 93.0% |
| 2016 | 132,148 | 6.8% | 93.2% |
| 2015 | 131,957 | 6.8% | 93.2% |
| 2014 | 131,802 | 6.8% | 93.2% |
| 2013 | 131,358 | 6.8% | 93.2% |
| 2012 | 131,019 | 6.8% | 93.2% |
| 2011 | 130,835 | 6.6% | 93.4% |
| 2010 | 130,976 | 6.3% | 93.7% |
Nativity & Citizenship FAQs for Wichita County, Texas
Approximately 6.7% of residents in Wichita County, Texas were born outside the United States.
The vast majority of residents, roughly 96.0%, are U.S. citizens (including both native-born and naturalized citizens).