Travis County, Texas Nativity & Citizenship Status (2024)
Place of birth and citizenship status analysis for Travis County, Texas
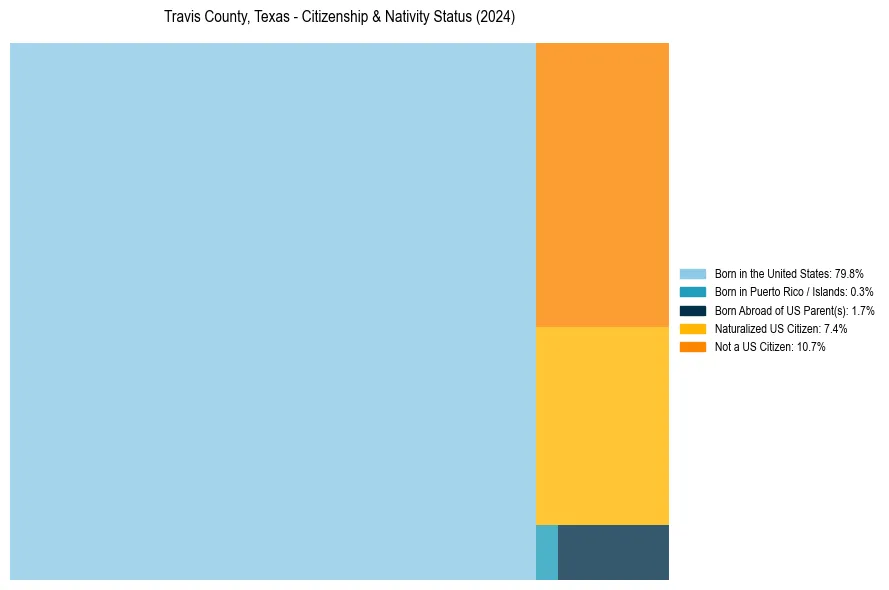
Travis County, Texas Nativity & Citizenship Indicators (2024)
Native Born
81.9%
Foreign Born
18.1%
Naturalized
7.4%
US Citizens
89.3%
Travis County, Texas Nativity & Citizenship Distribution
Travis County, Texas Historical Nativity Trends (2010–2024)
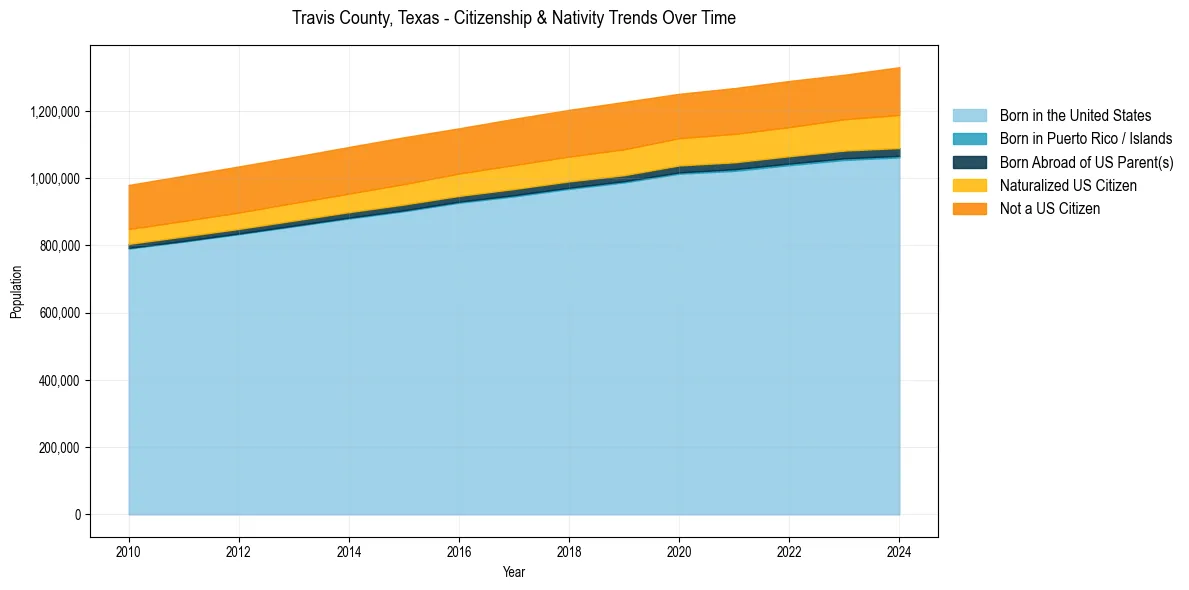
Travis County, Texas Population & Nativity History
| Year | Total Pop | Foreign Born | Native Born |
|---|---|---|---|
| 2024 | 1,330,015 | 18.1% | 81.9% |
| 2023 | 1,307,625 | 17.3% | 82.7% |
| 2022 | 1,289,054 | 17.4% | 82.6% |
| 2021 | 1,267,795 | 17.4% | 82.6% |
| 2020 | 1,250,884 | 17.0% | 83.0% |
| 2019 | 1,226,805 | 17.8% | 82.2% |
| 2018 | 1,203,166 | 17.7% | 82.3% |
| 2017 | 1,176,584 | 17.8% | 82.2% |
| 2016 | 1,148,176 | 17.5% | 82.5% |
| 2015 | 1,121,645 | 17.8% | 82.2% |
| 2014 | 1,092,810 | 17.8% | 82.2% |
| 2013 | 1,063,248 | 17.8% | 82.2% |
| 2012 | 1,034,842 | 18.0% | 82.0% |
| 2011 | 1,007,264 | 18.0% | 82.0% |
| 2010 | 979,712 | 17.9% | 82.1% |
Nativity & Citizenship FAQs for Travis County, Texas
Approximately 18.1% of residents in Travis County, Texas were born outside the United States.
The vast majority of residents, roughly 89.3%, are U.S. citizens (including both native-born and naturalized citizens).