Tom Green County, Texas Nativity & Citizenship Status (2024)
Place of birth and citizenship status analysis for Tom Green County, Texas
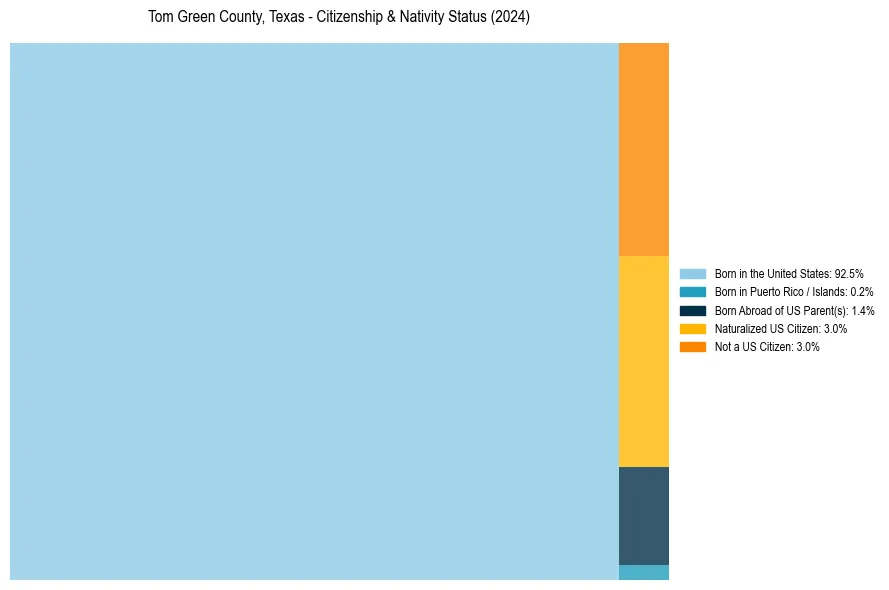
Tom Green County, Texas Nativity & Citizenship Indicators (2024)
Native Born
94.0%
Foreign Born
6.0%
Naturalized
3.0%
US Citizens
97.0%
Tom Green County, Texas Nativity & Citizenship Distribution
Tom Green County, Texas Historical Nativity Trends (2010–2024)
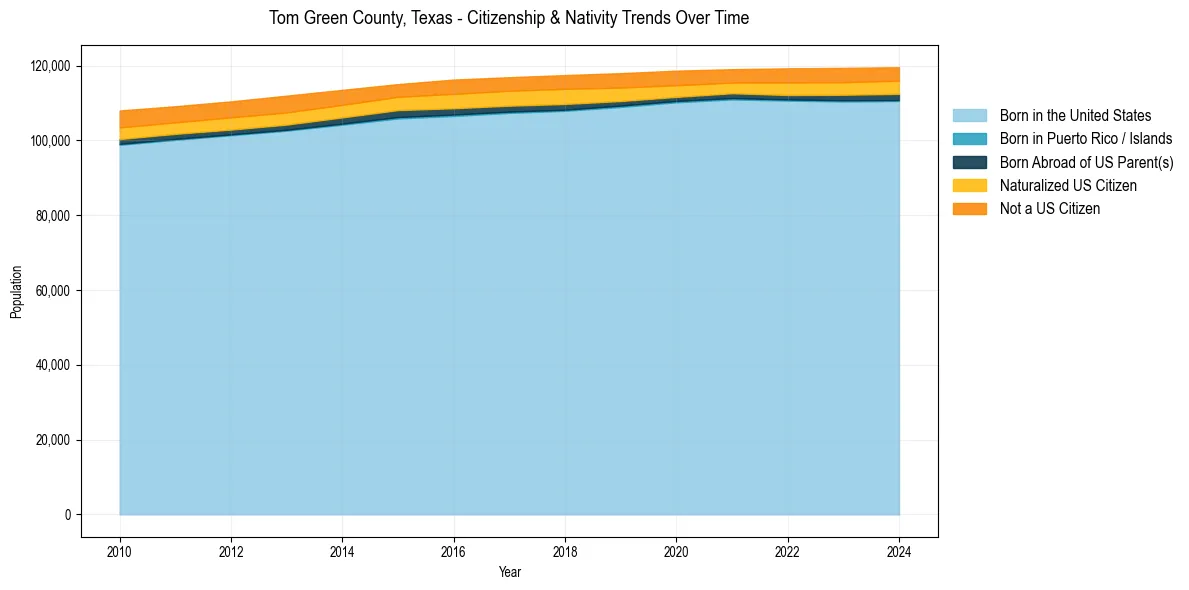
Tom Green County, Texas Population & Nativity History
| Year | Total Pop | Foreign Born | Native Born |
|---|---|---|---|
| 2024 | 119,577 | 6.0% | 94.0% |
| 2023 | 119,398 | 6.0% | 94.0% |
| 2022 | 119,276 | 6.0% | 94.0% |
| 2021 | 119,048 | 5.4% | 94.6% |
| 2020 | 118,645 | 5.9% | 94.1% |
| 2019 | 117,986 | 6.3% | 93.7% |
| 2018 | 117,466 | 6.6% | 93.4% |
| 2017 | 116,906 | 6.5% | 93.5% |
| 2016 | 116,264 | 6.6% | 93.4% |
| 2015 | 115,056 | 6.0% | 94.0% |
| 2014 | 113,516 | 6.5% | 93.5% |
| 2013 | 111,969 | 6.9% | 93.1% |
| 2012 | 110,434 | 6.8% | 93.2% |
| 2011 | 109,135 | 6.8% | 93.2% |
| 2010 | 108,000 | 7.1% | 92.9% |
Nativity & Citizenship FAQs for Tom Green County, Texas
Approximately 6.0% of residents in Tom Green County, Texas were born outside the United States.
The vast majority of residents, roughly 97.0%, are U.S. citizens (including both native-born and naturalized citizens).