Tarrant County, Texas Nativity & Citizenship Status (2024)
Place of birth and citizenship status analysis for Tarrant County, Texas
Tarrant County, Texas Nativity & Citizenship Indicators (2024)
Native Born
82.8%
Foreign Born
17.2%
Naturalized
7.3%
US Citizens
90.1%
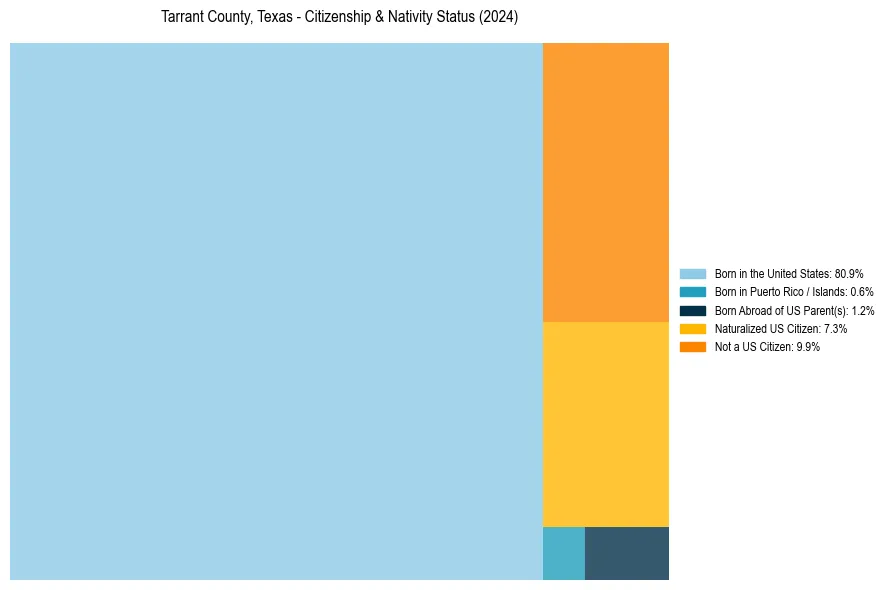
Tarrant County, Texas Nativity & Citizenship Distribution
Tarrant County, Texas Historical Nativity Trends (2010–2024)
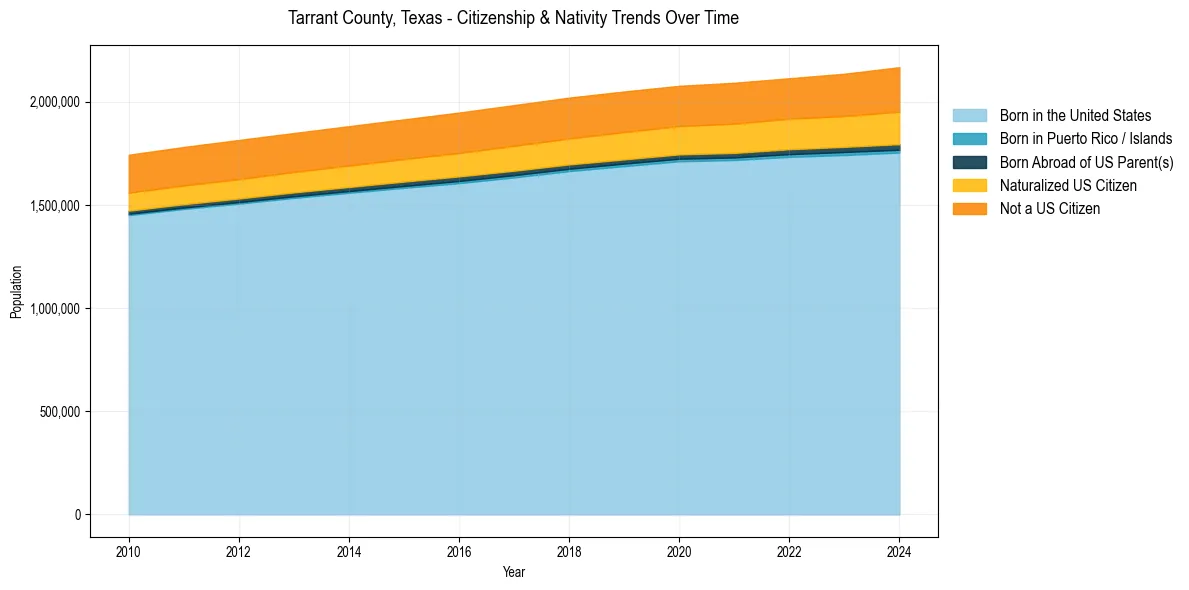
Tarrant County, Texas Population & Nativity History
| Year | Total Pop | Foreign Born | Native Born |
|---|---|---|---|
| 2024 | 2,167,390 | 17.2% | 82.8% |
| 2023 | 2,135,743 | 16.6% | 83.4% |
| 2022 | 2,113,854 | 16.3% | 83.7% |
| 2021 | 2,091,953 | 16.3% | 83.7% |
| 2020 | 2,077,153 | 16.0% | 84.0% |
| 2019 | 2,049,770 | 16.1% | 83.9% |
| 2018 | 2,019,977 | 16.0% | 84.0% |
| 2017 | 1,983,675 | 16.0% | 84.0% |
| 2016 | 1,947,529 | 15.9% | 84.1% |
| 2015 | 1,914,526 | 15.8% | 84.2% |
| 2014 | 1,881,469 | 15.7% | 84.3% |
| 2013 | 1,848,423 | 15.6% | 84.4% |
| 2012 | 1,814,667 | 15.6% | 84.4% |
| 2011 | 1,780,700 | 15.6% | 84.4% |
| 2010 | 1,743,300 | 15.6% | 84.4% |
Nativity & Citizenship FAQs for Tarrant County, Texas
Approximately 17.2% of residents in Tarrant County, Texas were born outside the United States.
The vast majority of residents, roughly 90.1%, are U.S. citizens (including both native-born and naturalized citizens).