Tarrant County, Texas Health Insurance Coverage (2024)
Detailed analysis of uninsured rates and coverage trends for Tarrant County, Texas
Universe
2,149,206
Total Uninsured
359,852
Uninsured Rate
16.7%
Coverage by Age and Gender
Distribution of insured vs. uninsured residents in Tarrant County, Texas
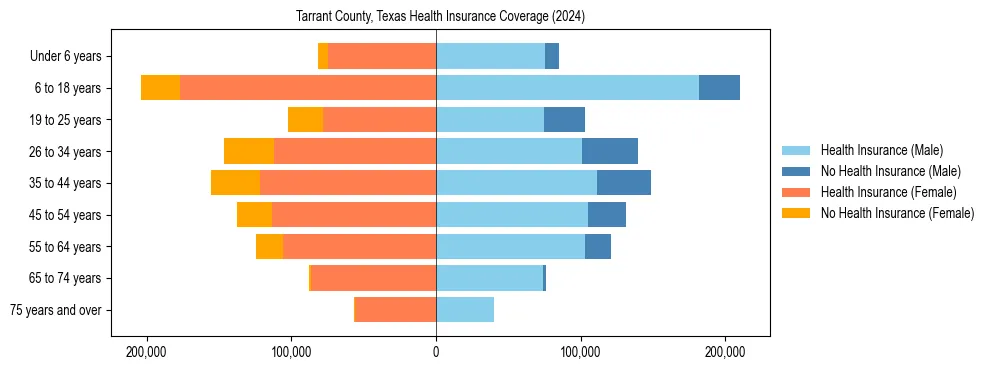
Uninsured Rates by Demographic Group
Under 18 Years
Male Uninsured13.0%
Female Uninsured11.7%
18 to 34 Years
Male Uninsured27.9%
Female Uninsured23.6%
35 to 64 Years
Male Uninsured20.2%
Female Uninsured18.3%
65 Years & Over
Male Uninsured1.8%
Female Uninsured1.6%
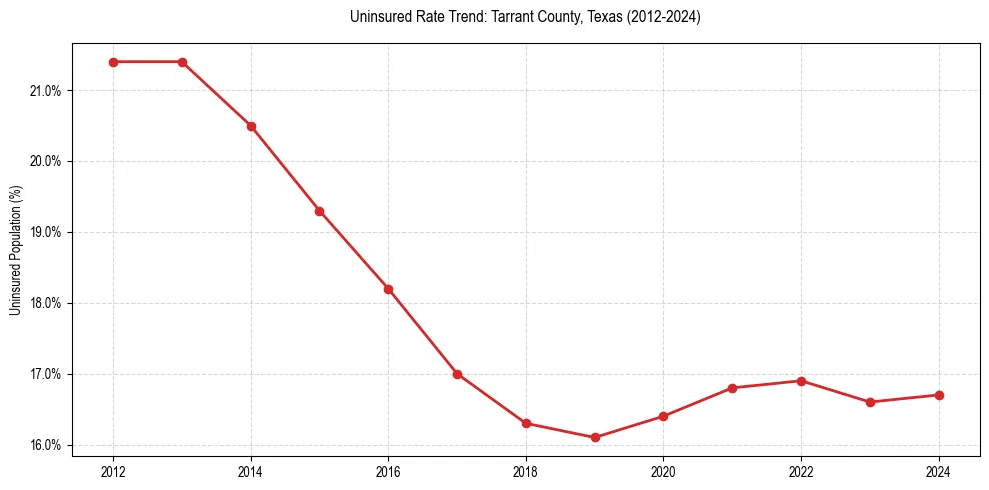
Uninsured Rate Trends
Historical coverage data from 2012 to 2024
| Year | Total Uninsured | Uninsured Rate |
|---|---|---|
| 2024 | 359,852 | 16.7% |
| 2023 | 351,295 | 16.6% |
| 2022 | 354,610 | 16.9% |
| 2021 | 348,156 | 16.8% |
| 2020 | 337,553 | 16.4% |
| 2019 | 326,577 | 16.1% |
| 2018 | 327,238 | 16.3% |
| 2017 | 333,813 | 17.0% |
| 2016 | 351,757 | 18.2% |
| 2015 | 366,446 | 19.3% |
| 2014 | 382,565 | 20.5% |
| 2013 | 391,216 | 21.4% |
| 2012 | 384,250 | 21.4% |
Frequently Asked Questions
Approximately 16.7% of the population in Tarrant County, Texas does not have health insurance coverage.
In Tarrant County, Texas, young adult males (18-34) face the highest barrier to coverage, with an uninsured rate of 27.9%. This is notably higher than the overall local average of 16.7%.