Smith County, Texas Nativity & Citizenship Status (2024)
Place of birth and citizenship status analysis for Smith County, Texas
Smith County, Texas Nativity & Citizenship Indicators (2024)
Native Born
91.2%
Foreign Born
8.8%
Naturalized
3.8%
US Citizens
95.0%
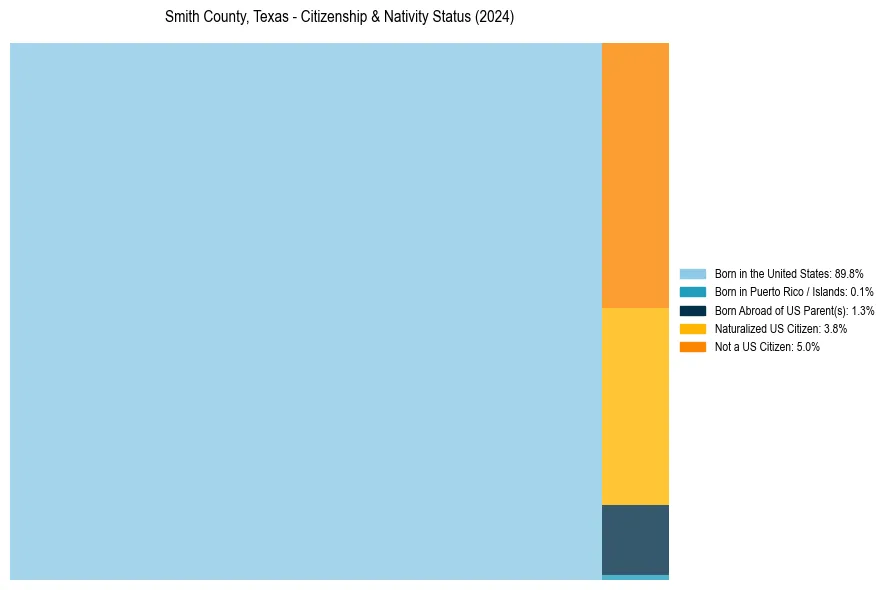
Smith County, Texas Nativity & Citizenship Distribution
Smith County, Texas Historical Nativity Trends (2010–2024)
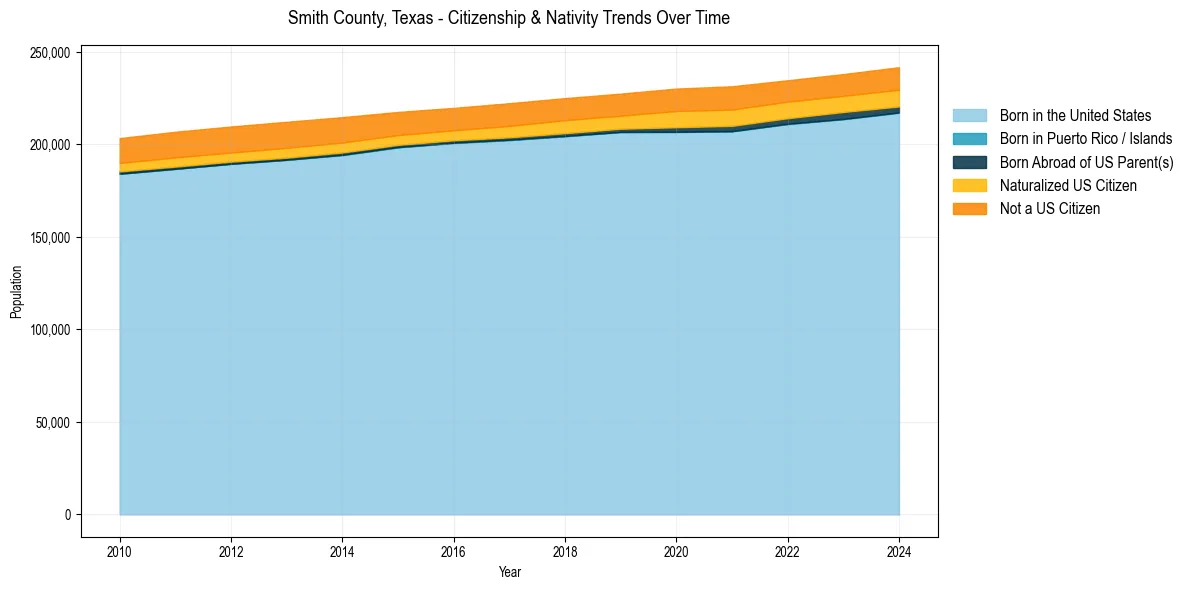
Smith County, Texas Population & Nativity History
| Year | Total Pop | Foreign Born | Native Born |
|---|---|---|---|
| 2024 | 241,740 | 8.8% | 91.2% |
| 2023 | 238,014 | 8.6% | 91.4% |
| 2022 | 234,667 | 8.7% | 91.3% |
| 2021 | 231,429 | 9.3% | 90.7% |
| 2020 | 230,184 | 9.1% | 90.9% |
| 2019 | 227,449 | 8.3% | 91.7% |
| 2018 | 225,015 | 8.4% | 91.6% |
| 2017 | 222,277 | 8.3% | 91.7% |
| 2016 | 219,745 | 8.0% | 92.0% |
| 2015 | 217,552 | 8.2% | 91.8% |
| 2014 | 214,735 | 8.9% | 91.1% |
| 2013 | 212,227 | 9.1% | 90.9% |
| 2012 | 209,691 | 9.1% | 90.9% |
| 2011 | 206,839 | 9.1% | 90.9% |
| 2010 | 203,393 | 8.8% | 91.2% |
Nativity & Citizenship FAQs for Smith County, Texas
Approximately 8.8% of residents in Smith County, Texas were born outside the United States.
The vast majority of residents, roughly 95.0%, are U.S. citizens (including both native-born and naturalized citizens).