Rockwall County, Texas Nativity & Citizenship Status (2024)
Place of birth and citizenship status analysis for Rockwall County, Texas
Rockwall County, Texas Nativity & Citizenship Indicators (2024)
Native Born
91.1%
Foreign Born
8.9%
Naturalized
5.5%
US Citizens
96.5%
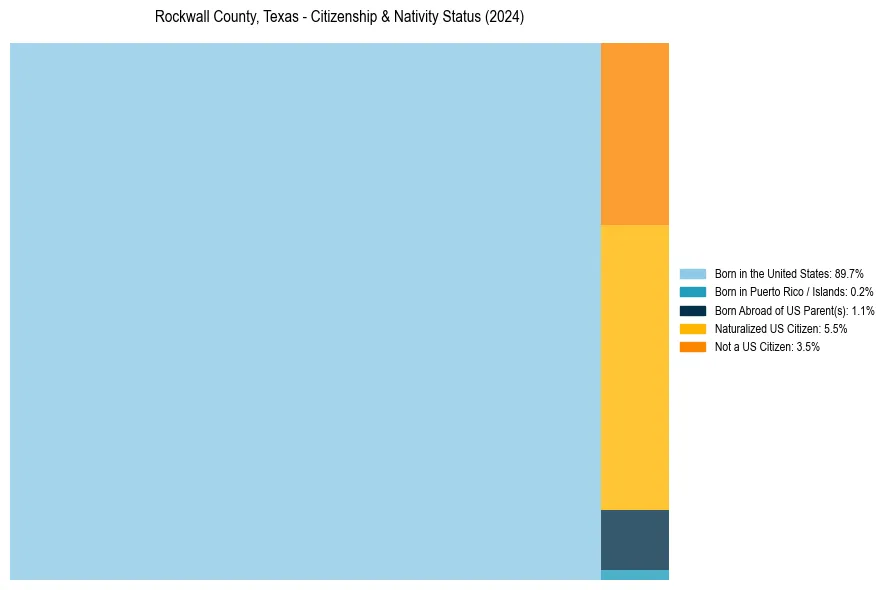
Rockwall County, Texas Nativity & Citizenship Distribution
Rockwall County, Texas Historical Nativity Trends (2010–2024)
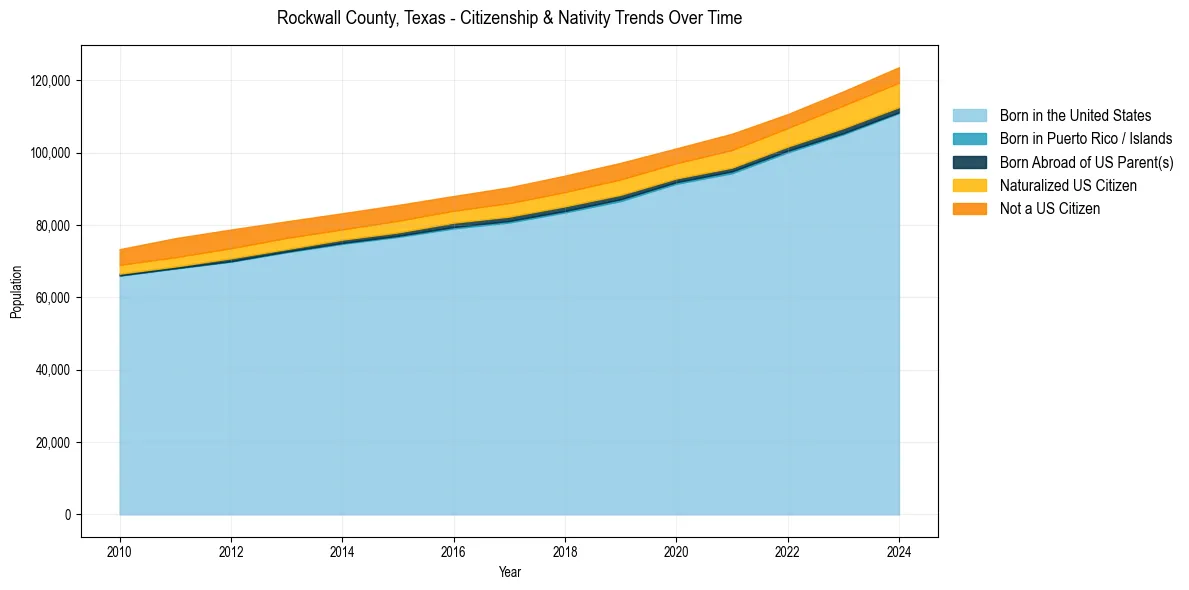
Rockwall County, Texas Population & Nativity History
| Year | Total Pop | Foreign Born | Native Born |
|---|---|---|---|
| 2024 | 123,617 | 8.9% | 91.1% |
| 2023 | 116,931 | 8.7% | 91.3% |
| 2022 | 110,631 | 8.1% | 91.9% |
| 2021 | 105,227 | 8.9% | 91.1% |
| 2020 | 101,175 | 8.2% | 91.8% |
| 2019 | 97,175 | 9.1% | 90.9% |
| 2018 | 93,642 | 9.1% | 90.9% |
| 2017 | 90,414 | 9.0% | 91.0% |
| 2016 | 88,010 | 8.4% | 91.6% |
| 2015 | 85,536 | 8.9% | 91.1% |
| 2014 | 83,239 | 8.8% | 91.2% |
| 2013 | 81,020 | 9.5% | 90.5% |
| 2012 | 78,749 | 10.1% | 89.9% |
| 2011 | 76,349 | 10.3% | 89.7% |
| 2010 | 73,311 | 9.3% | 90.7% |
Nativity & Citizenship FAQs for Rockwall County, Texas
Approximately 8.9% of residents in Rockwall County, Texas were born outside the United States.
The vast majority of residents, roughly 96.5%, are U.S. citizens (including both native-born and naturalized citizens).