Potter County, Texas Nativity & Citizenship Status (2024)
Place of birth and citizenship status analysis for Potter County, Texas
Potter County, Texas Nativity & Citizenship Indicators (2024)
Native Born
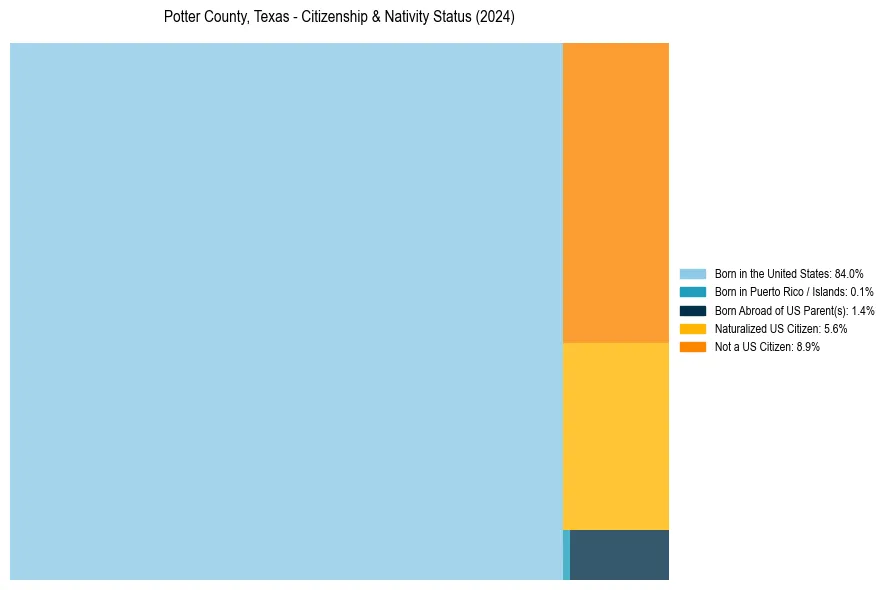
85.5%
Foreign Born
14.5%
Naturalized
5.6%
US Citizens
91.1%
Potter County, Texas Nativity & Citizenship Distribution
Potter County, Texas Historical Nativity Trends (2010–2024)
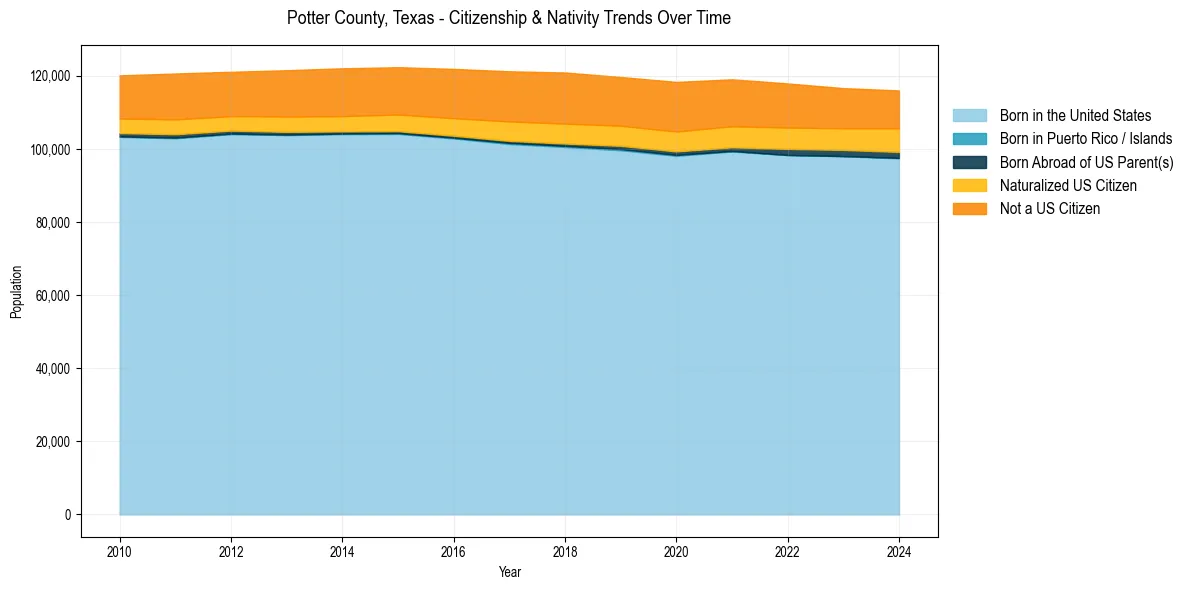
Potter County, Texas Population & Nativity History
| Year | Total Pop | Foreign Born | Native Born |
|---|---|---|---|
| 2024 | 115,975 | 14.5% | 85.5% |
| 2023 | 116,634 | 14.5% | 85.5% |
| 2022 | 117,905 | 15.2% | 84.8% |
| 2021 | 119,043 | 15.6% | 84.4% |
| 2020 | 118,323 | 16.1% | 83.9% |
| 2019 | 119,674 | 15.7% | 84.3% |
| 2018 | 120,899 | 16.1% | 83.9% |
| 2017 | 121,230 | 15.7% | 84.3% |
| 2016 | 121,883 | 15.0% | 85.0% |
| 2015 | 122,352 | 14.3% | 85.7% |
| 2014 | 122,053 | 14.2% | 85.8% |
| 2013 | 121,526 | 13.9% | 86.1% |
| 2012 | 121,099 | 13.3% | 86.7% |
| 2011 | 120,626 | 13.8% | 86.2% |
| 2010 | 120,124 | 13.2% | 86.8% |
Nativity & Citizenship FAQs for Potter County, Texas
Approximately 14.5% of residents in Potter County, Texas were born outside the United States.
The vast majority of residents, roughly 91.1%, are U.S. citizens (including both native-born and naturalized citizens).