Nueces County, Texas Nativity & Citizenship Status (2024)
Place of birth and citizenship status analysis for Nueces County, Texas
Nueces County, Texas Nativity & Citizenship Indicators (2024)
Native Born
91.6%
Foreign Born
8.4%
Naturalized
3.3%
US Citizens
94.9%
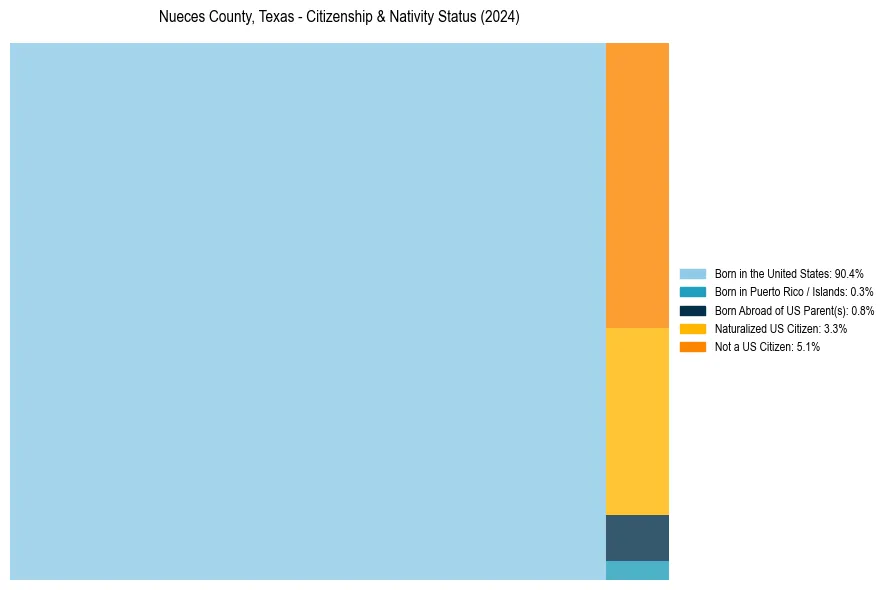
Nueces County, Texas Nativity & Citizenship Distribution
Nueces County, Texas Historical Nativity Trends (2010–2024)
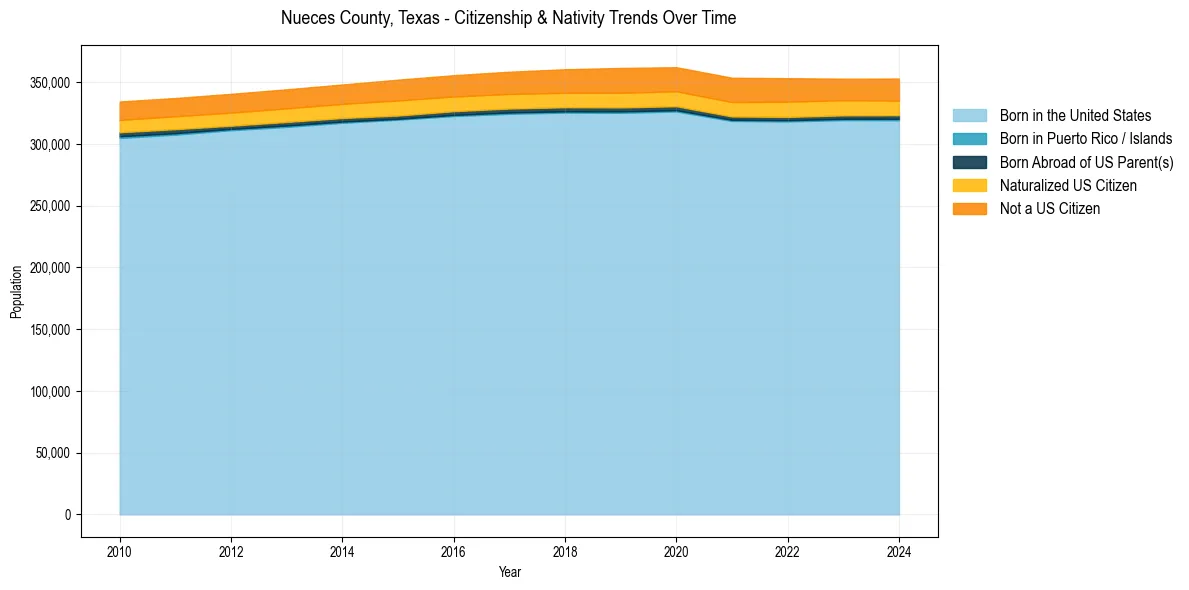
Nueces County, Texas Population & Nativity History
| Year | Total Pop | Foreign Born | Native Born |
|---|---|---|---|
| 2024 | 352,955 | 8.4% | 91.6% |
| 2023 | 352,829 | 8.4% | 91.6% |
| 2022 | 353,245 | 8.9% | 91.1% |
| 2021 | 353,594 | 8.9% | 91.1% |
| 2020 | 362,151 | 8.7% | 91.3% |
| 2019 | 361,540 | 8.9% | 91.1% |
| 2018 | 360,486 | 8.5% | 91.5% |
| 2017 | 358,484 | 8.3% | 91.7% |
| 2016 | 355,667 | 8.2% | 91.8% |
| 2015 | 352,060 | 8.3% | 91.7% |
| 2014 | 348,130 | 7.8% | 92.2% |
| 2013 | 344,257 | 7.7% | 92.3% |
| 2012 | 340,568 | 7.6% | 92.4% |
| 2011 | 337,182 | 7.5% | 92.5% |
| 2010 | 334,370 | 7.5% | 92.5% |
Nativity & Citizenship FAQs for Nueces County, Texas
Approximately 8.4% of residents in Nueces County, Texas were born outside the United States.
The vast majority of residents, roughly 94.9%, are U.S. citizens (including both native-born and naturalized citizens).