Texas Nativity & Citizenship Status (2024)
Place of birth and citizenship status analysis for Texas
Texas Nativity & Citizenship Indicators (2024)
Native Born
82.4%
Foreign Born
17.6%
Naturalized
7.4%
US Citizens
89.8%
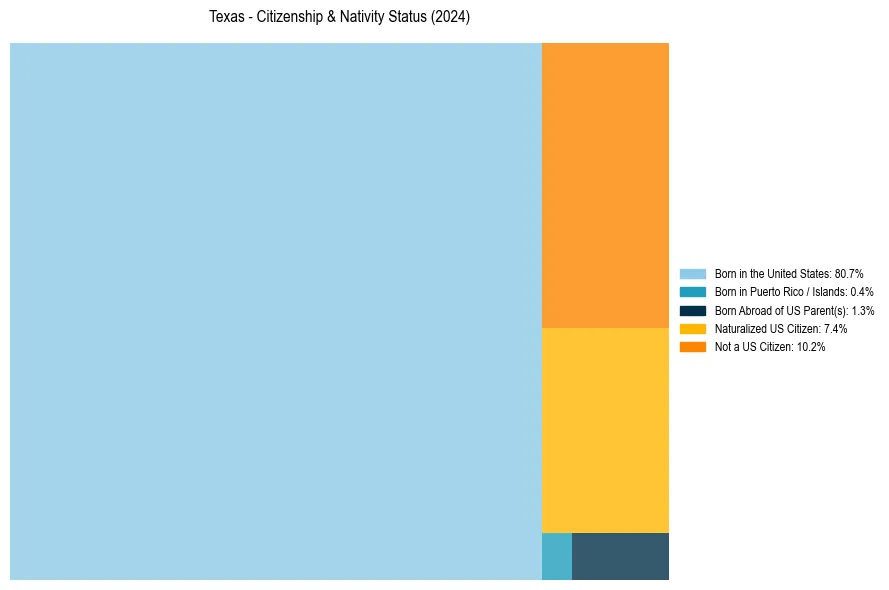
Texas Nativity & Citizenship Distribution
Texas Historical Nativity Trends (2010–2024)
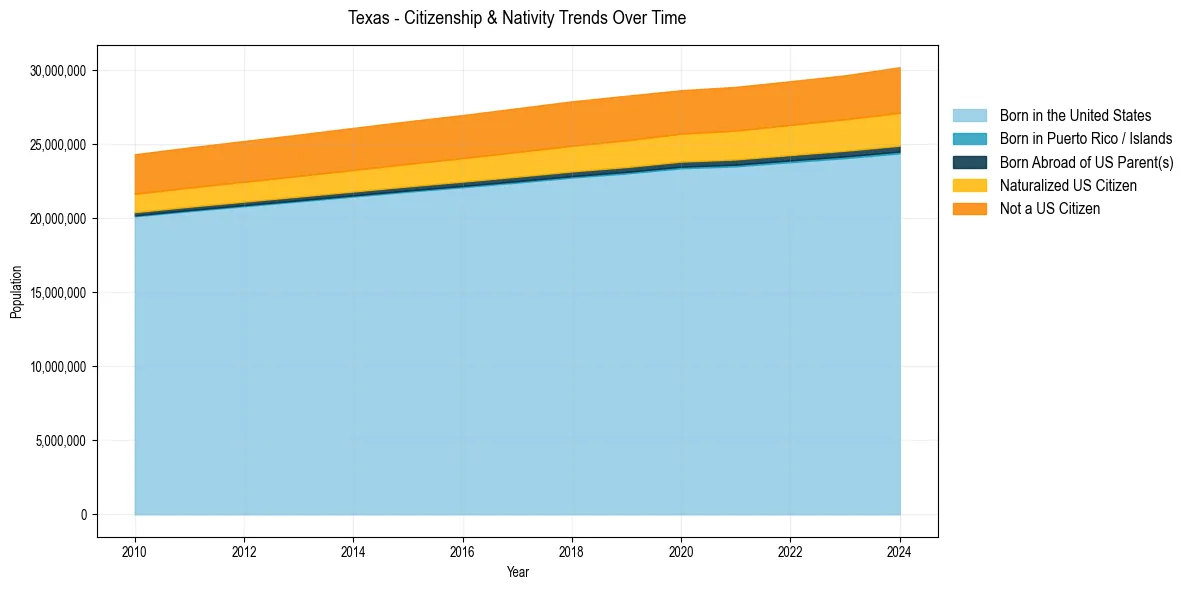
Texas Population & Nativity History
| Year | Total Pop | Foreign Born | Native Born |
|---|---|---|---|
| 2024 | 30,188,424 | 17.6% | 82.4% |
| 2023 | 29,640,343 | 17.2% | 82.8% |
| 2022 | 29,243,342 | 17.1% | 82.9% |
| 2021 | 28,862,581 | 17.0% | 83.0% |
| 2020 | 28,635,442 | 16.8% | 83.2% |
| 2019 | 28,260,856 | 17.0% | 83.0% |
| 2018 | 27,885,195 | 17.0% | 83.0% |
| 2017 | 27,419,612 | 16.9% | 83.1% |
| 2016 | 26,956,435 | 16.7% | 83.3% |
| 2015 | 26,538,614 | 16.6% | 83.4% |
| 2014 | 26,092,033 | 16.5% | 83.5% |
| 2013 | 25,639,373 | 16.3% | 83.7% |
| 2012 | 25,208,897 | 16.3% | 83.7% |
| 2011 | 24,774,187 | 16.2% | 83.8% |
| 2010 | 24,311,891 | 16.1% | 83.9% |
Nativity & Citizenship FAQs for Texas
Approximately 17.6% of residents in Texas were born outside the United States.
The vast majority of residents, roughly 89.8%, are U.S. citizens (including both native-born and naturalized citizens).